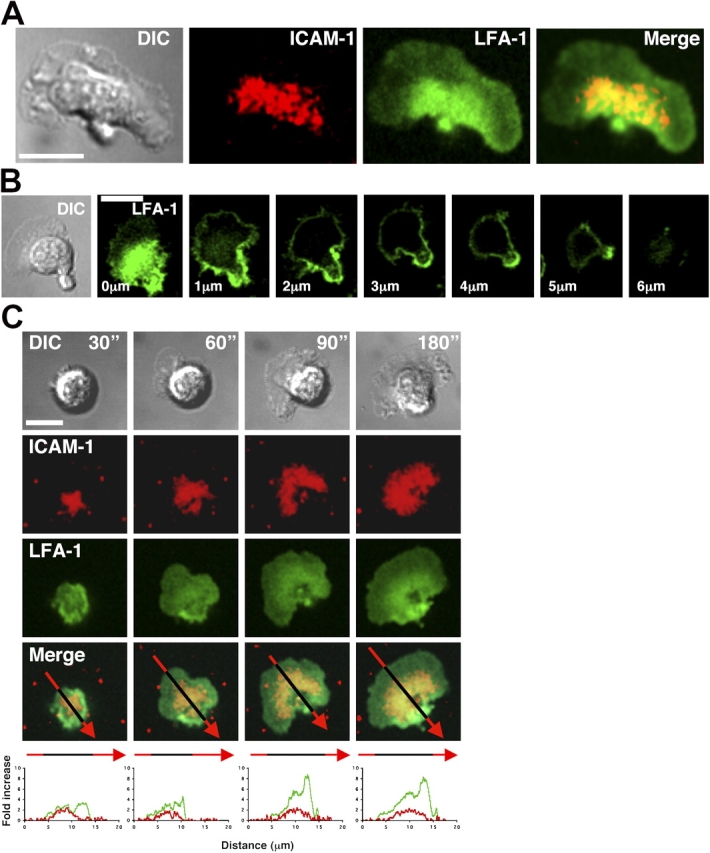
Figure 3.

LFA-1 surface distribution on T cells migrating on ICAM-1. Alexa 488–labeled nonfunctional blocking anti–LFA-1 Fab′ is used to identify surface distribution of LFA-1 without cross-linking or affecting ICAM-1 binding activity. (A) Distribution of ICAM-1 (red) and LFA-1 (green) on a migrating T cell at the lipid bilayer level. The merge image demonstrates colocalization of LFA-1 and ICAM-1 in the mid-cell region. (B) Confocal z-stack (each slice = 1 μm) through a T cell migrating on ICAM-1. LFA-1 (green) is most intense at the level of the lipid bilayer in the mid-cell region, with weak expression in the lamellipodia. LFA-1 is visible over the entire surface, with a pattern of increased intensity toward the trailing edge and the uropod. (C) Distribution of LFA-1 (green) and concentrated ICAM-1 (red) was recorded over 180 s after initial contact with ICAM-1 in the lipid bilayer. The top panels show DIC images of a T cell polarizing and migrating. The bottom image panels illustrate the merged LFA-1 and ICAM-1 signals. The arrows (Merge) are split into red (bilayer only) and black (cell and bilayer) and show the regions where the profile data (bottom) was calculated. The arrow tip is located at the trailing edge. The graphs depict the fold increase of LFA-1 compared with the single plasma membrane level in the lamellipodia (green) and ICAM-1 compared with the bilayer level (red) over the entire T cell between 30–180 s after initial contact. All images were taken with 63× oil immersion objective. Bars, 10 μm.
