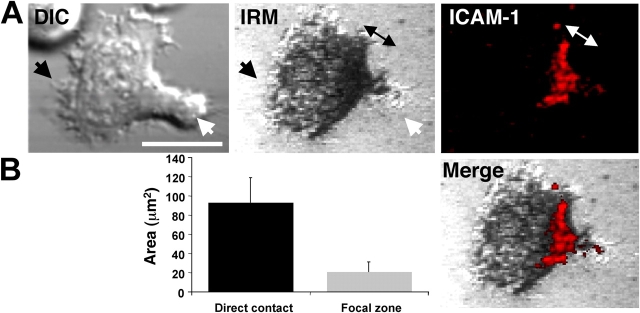
Figure 4.
IRM reveals the areas of direct contact between migrating T cells and ICAM-1. (A) The DIC image compared with the IRM image and the ICAM-1 binding focal zone (red). The IRM image identifies the total area of the T cell in direct contact with ICAM-1 in the bilayer and demonstrates intermittent, close, and lack of attachments in lamellipodia, focal zone, and uropod, respectively. Double-sided arrow, closest attachment to the substrate; black arrow, the leading edge; white arrow, the uropod of the migrating T cell. Overlaying the ICAM-1 and IRM images shows that the area of uniform attachment colocalizes with the focal zone. (B) Quantification of the area in contact with the bilayer compared with the area of the focal zone (n = 10; ±SD). All images were taken with a 63× oil immersion objective. Bars, 10 μm.

