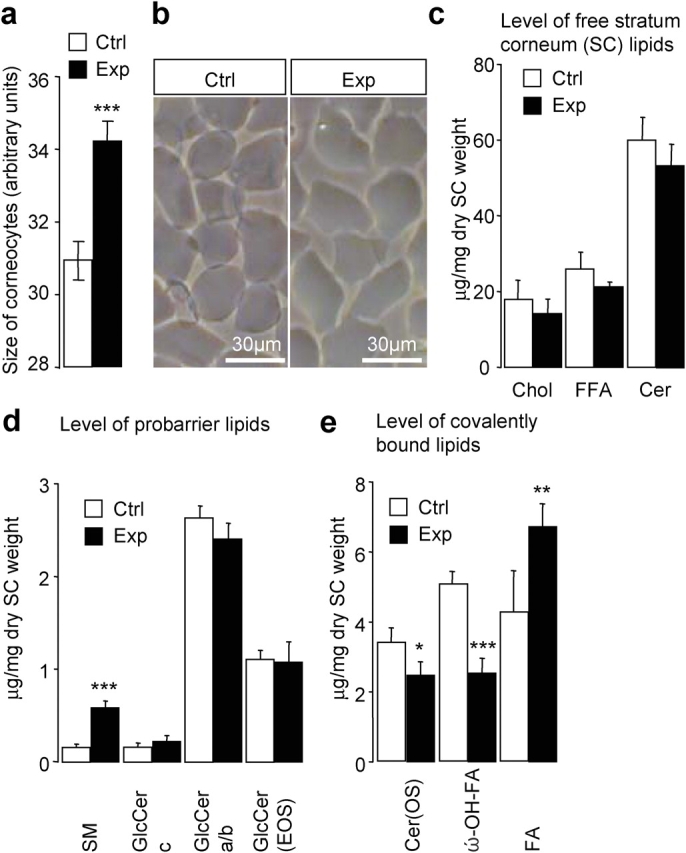
Figure 4.

Enlarged corneocytes and altered SC lipid composition in knockout mice. (a) Mean surface area of cells from control (white bar; n = 15–50 corneocytes; n = 6 mice) and knockout (Exp) mice (black bar; n = 15–50 corneocytes; n = 5 mice). ***, P < 0.001. (b) Morphological appearance of purified cells that are isolated from the control (left) and knockout (right) epidermis. (c) Levels of main free SC lipids. Chol, cholesterol; FFA, free fatty acid; Cer, ceramides. (d) Analysis of probarrier lipids. Note the increased amount of sphingomyelin (SM) in the knockout group (***, P < 0.001), whereas levels of different glucosylceramide fractions (GlcCer c, GlcCer a/b, and GlcCer(EOS); N-acyl fatty acid acylated in ω-OH position) were unaltered. (e) Level of covalently bound lipids. Note the 50% reduced amount of ω-hydroxylated fatty acid (ω-OH–FA; ***, P < 0.001), the decrease in ceramides (Cer[OS]); *, P < 0.05), and the significantly increased fatty acid (FA; **, P < 0.01) levels in knockout (Prss8 lox/Δ /K14-Cre; black bar) versus control (Prss8 lox/+ ; white bar) groups. Each value is the mean of five animals ± SEM (error bars).
