
Figure 1.
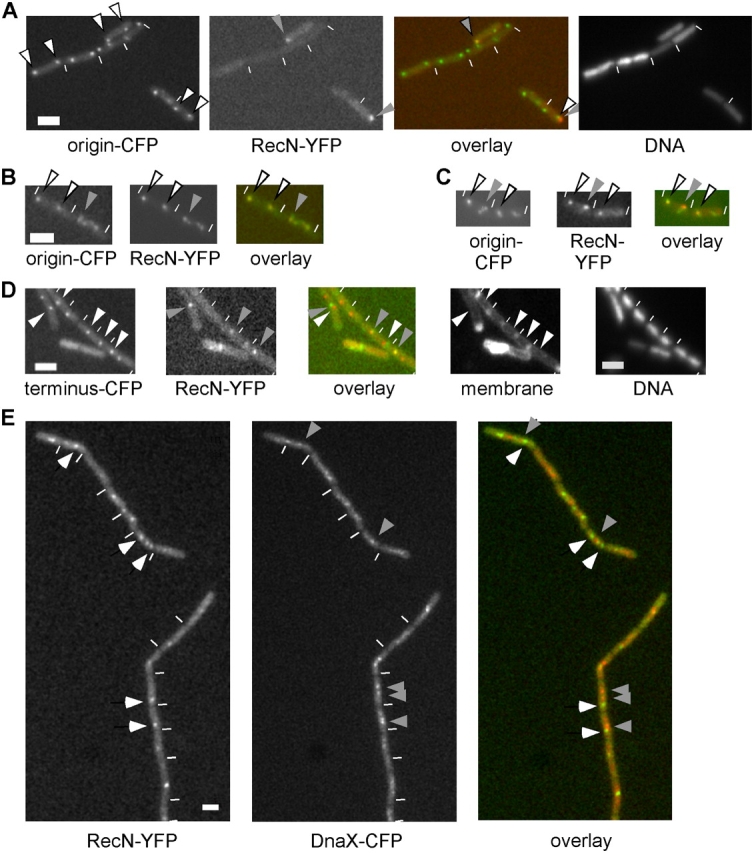
Fluorescence microscopy of B. subtilis cells in which DSBs were induced by different means. (A–C) Cells carrying the origin region tagged with LacI-CFP (origin-CFP, green in the overlay) and the HO cut site integrated next to the CFP-tagged site 1 h after induction of HO endonuclease. (A) White arrowheads indicate positions of origin regions; gray arrowheads indicate positions of RecN foci (red in the overlay). (B and C) White arrowheads indicate origins and RecN foci; gray arrowheads indicate abnormal origin signals. (D) Cells carrying LacI-CFP and the HO cut site close to the terminus region (terminus-CFP) 1 h after induction of HO endonuclease. White arrowheads indicate terminus regions (green in overlay); gray arrowheads indicate RecN foci (red in overlay) or colocalization in the overlay. Note that all cells contain DNA. Nucleoids are decondensed after DSBs, and staining is quite heterogeneous. (E) Strain AV2 (recN-yfp and dnaX-cfp) 60 min after the addition of 100 ng/ml MMC. White arrowheads indicate YFP-RecN foci (green in the overlay); gray arrows indicate DnaX-CFP foci (red in the overlay). (A–E) White lines indicate the ends of cells. Bars, 2 μm.