
Figure 10.
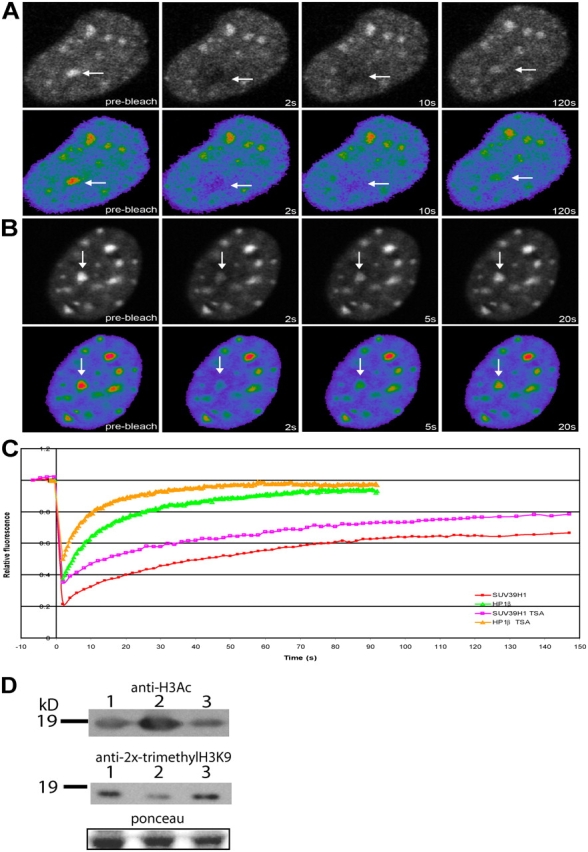
Inhibition of histone deacetylase activity increases the dynamics of both SUV39H1 and HP1β. NIH3T3 cells were transfected with EYFP-SUV39H1 (A) or EYFP-HP1β (B) and treated with 50 ng/ml TSA. After 18–22 h of TSA treatment, a heterochromatic area was selected and photobleached. Images were recorded just before and at different time intervals after photobleaching. Arrows indicate the photobleached areas. (C) The corresponding FRAP curves are plotted together with the FRAP curves for EYFP-SUV39H1 and EYFP-HP1β obtained from nontreated cells. Curves represent means from 22 and 8 cells, respectively. (D) Western blots showing the levels of acetylation and trimethylation in nontreated (lane 1), TSA-treated (lane 2), and 5-aza-C–treated (lane 3) NIH3T3 cells. Ponceau staining shows equal protein loading.