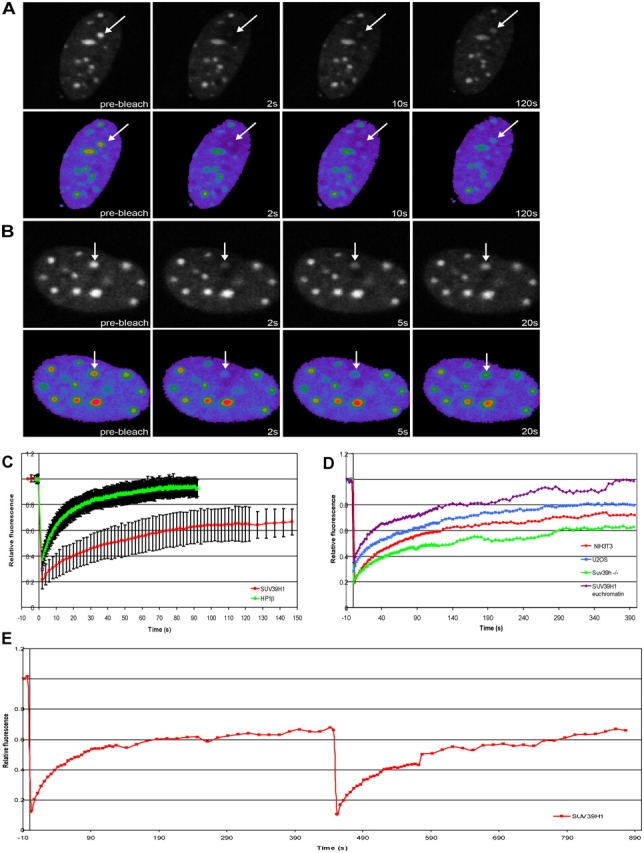
Figure 3.

FRAP analysis of EYFP-SUV39H1 and EYFP-HP1β shows that SUV39H1 is a less dynamic component of heterochromatin. NIH3T3 cells were transfected with EYFP-SUV39H1 (A) or EYFP-HP1β (B). A heterochromatic area was selected and photobleached. Images were recorded just before bleaching and at different time intervals after bleaching. Arrows indicate the photobleached region. To illustrate the recovery of fluorescence more clearly, pseudocolor images of the bleached cells are shown. Fluorescent intensities range from blue (low) to red (high). (C) Relative fluorescence intensities are displayed in recovery curves. Fluorescence recovery of EYFP-SUV39H1 reached a plateau at ∼70% after 140 s. Fluorescence recovery of EYFP-HP1β reached a plateau at ∼95% after 60 s. The curves represent mean values from 37 and 24 cells, respectively. Error bars represent SD. (D) FRAP curves calculated after extended recovery periods of EYFP-SUV39H1 in heterochromatin of U2OS cells, of Suv39h dn PMEFs, and of NIH3T3 cells and in euchromatin of NIH3T3 cells. (E) FRAP curves obtained from two successive FRAP measurements. After fluorescence recovery after the first bleach, the same region was bleached for the second time, and the fluorescence recovery was measured. EYFP-SUV39H1 fully recovered after the second bleach to 70% of the initial amount of fluorescence measured before the first bleach.
