Figure 5.

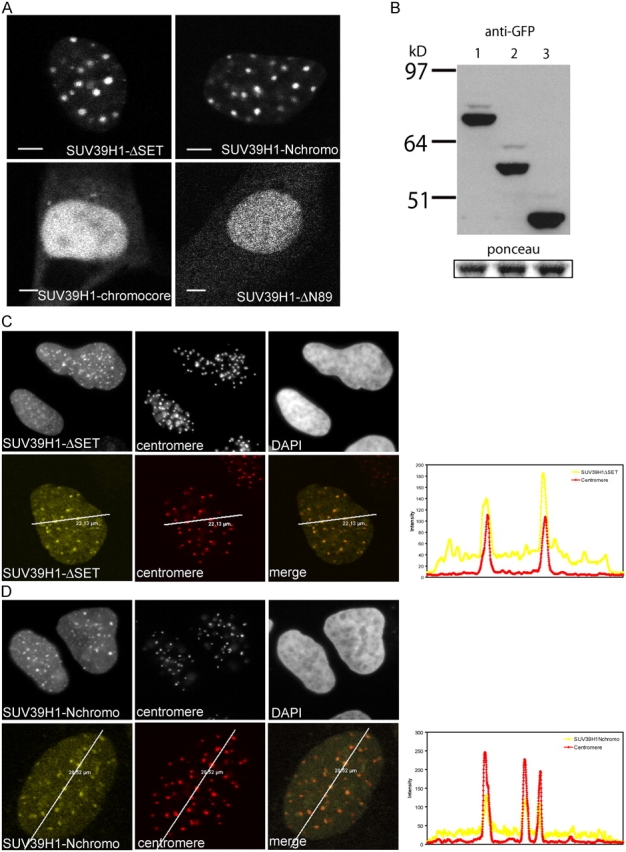
SUV39H1-ΔSET and SUV39H1-Nchromo are more concentrated at centromeres than SUV39H1. (A) Localization of the various SUV39H1 mutants in NIH3T3 cells. Bar, 10 μm. (B) Western blot showing expression of EYFP-SUV39H1 (lane 1), EYFP–SUV39H1-ΔSET (lane 2), and EYFP–SUV39H1-Nchromo (lane 3). Ponceau staining shows equal loading of the gel. (C) The top panel shows the distribution of EYFP–SUV39H1-ΔSET, centromeres, and DNA in a U2OS cell. The bottom panel shows a single optical section of a U2OS cell expressing EYFP–SUV39H1-ΔSET (left) and stained for centromeres (middle). Colocalization of the two is shown in the right image. The line scan (diagonal lines through the images) shows the local intensity distribution of EYFP–SUV39H1-ΔSET in yellow and centromere labeling in red. (D) Simultaneous detection of EYFP–SUV39H1-Nchromo (left) and centromeres (middle) in a U2OS cell. DNA is stained by DAPI (top right). The bottom panel shows a single optical section and a line scan (diagonal lines through the images) giving the local intensity distribution of EYFP–SUV39H1-Nchromo (yellow) and centromere staining (red).
