
Figure 6.
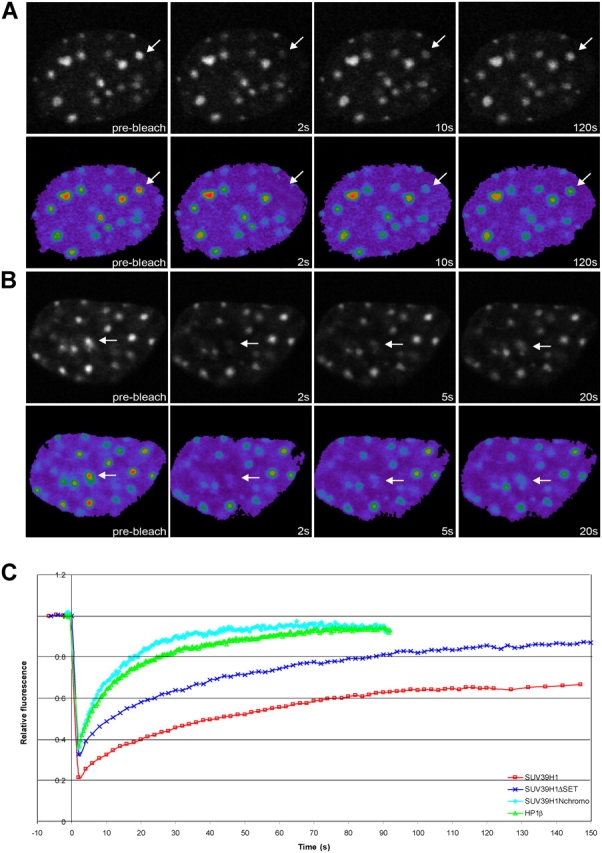
SUV39H1-ΔSET and SUV39H1-Nchromo have a higher mobility rate than full-length SUV39H1. After transfection of NIH3T3 cells with EYFP–SUV39H1-ΔSET (A) or EYFP–SUV39H1-Nchromo (B), a heterochromatic area was selected and photobleached. Images were recorded just before and at different time intervals after bleaching. Arrows indicate the photobleached areas. (C) The corresponding FRAP curves are plotted together with the FRAP curves for EYFP-SUV39H1 and EYFP-HP1β. These curves indicate that EYFP–SUV39H1-ΔSET and EYFP–SUV39H1-Nchromo are more dynamic than the full-length protein. The FRAP curves for the two mutant proteins represent means from 30 and 14 cells, respectively.