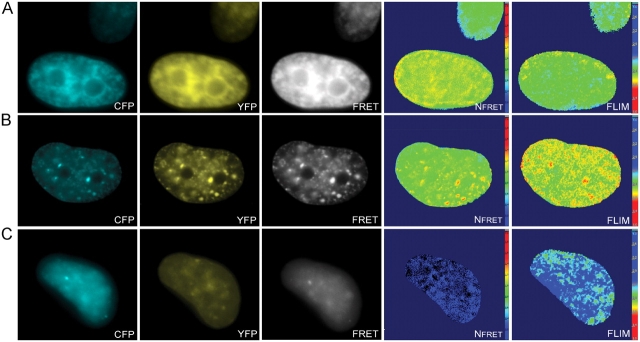
Figure 8.
FRET measurements confirm the interaction between different autofluorescent fusion proteins. U2OS cells were cotransfected with ECFP-SUV39H1 and EYFP-HP1β (A), with ECFP–SUV39H1-ΔSET and EYFP-HP1β (B), or with ECFP–SUV39H1-ΔN89 and EYFP-HP1β (C). A CFP, YFP, and FRET image was acquired from all cells for spectral measurements, and a FLIM stack was collected to calculate fluorescent lifetimes. The CFP, YFP, and FRET images were first corrected for pixel shift and background. Then, the NFRET values were calculated and displayed in pseudocolors (Nfret). Absence of FRET is indicated by blue as depicted in the scale. The fluorescent lifetime values are also displayed in pseudocolors (FLIM). Blue (as depicted in the scale) indicates a lifetime of 2.5 ns and an absence of FRET.

