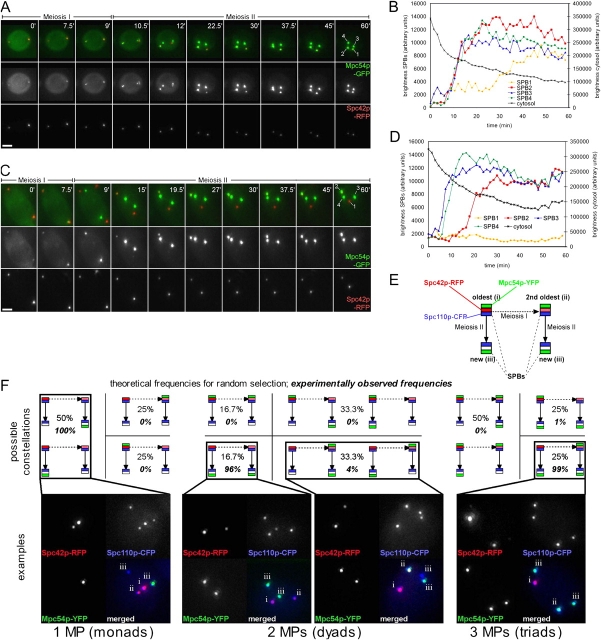
Figure 3.
Dynamics of MP assembly and stochastic SPB selection. (A) Live cell imaging of a cell that forms four MPs and (C) of a cell that forms three MPs. MPs were visualized using Mpc54p-GFP, whereas Spc42p-RFP was used to label old SPBs. Selected frames (maximum projections) at the indicated time points after the start of recording are shown. Time is given in minutes. Bars, 2 μm. The full videos are provided as Videos 1 and 2, available at http://www.jcb.org/cgi/content/full/jcb.200507168/DC1. (B) Quantification of cytoplasmic- and SPB-localized Mpc54p-GFP fluorescence intensity from A. The numbering of the SPBs corresponds to the numbering shown in the last frame of the video snapshots depicted in A. (D) Quantification (see B) of C. (E) SPBs of three different generations are present in meiosis II. The cartoon outlines the relationship of SPBs and fluorescent protein labels used for the experiment shown in F. Arrows indicate duplication of SPBs during meiosis I (dashed arrow) and meiosis II (normal arrows). MPs were visualized using Mpc54p-YFP (green signals) and the position of all SPBs using CFP fused to the inner plaque protein Spc110p (blue signals; Kilmartin et al., 1993). Old and new SPBs were discriminated based on the signal brightness of a fluorescent timer (RedStar/RFP; Knop et al., 2002) fused to the integral SPB component Spc42p (Donaldson and Kilmartin, 1996). This allows that SPBs from three different generations can be distinguished and that the age of the SPBs can be correlated with the assembly of MPs. (F) Distribution of MPs to SPBs from different generations in cells with different numbers of MPs. The pictograms show all theoretically possible constellations for the situation with one, two, or three MPs per cell. Pictograms for constellations that are indistinguishable by the used method are grouped together. The microscopic pictures show representative cells for selected cases. The oldest SPB (i) is marked with the brightest RFP signal, and the intermediate SPB (ii) is marked with the second brightest RFP signal. The position of the two new SPBs (iii) is indicated by the CFP label, whereas they are not or are only faintly labeled with the RFP marker. The percentage of occurrence of the different possible constellations that can be distinguished by this method as well as the theoretical random distribution are indicated. Yeast strain YCT806 was used for this experiment. 299 cells were evaluated.

