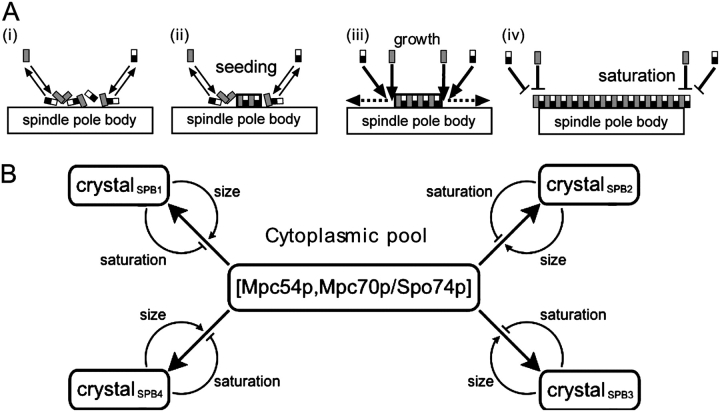
Figure 5.
Self-organization and feedback during MP assembly. (A) Schematic model for the formation of an MP. Gray rectangles represent Mpc54p, and black/white rectangles represent heterodimers formed from the association of Mpc70p with Spo74p. Black-bordered arrays of Mpc54p/Mpc70p/Spo74p represent crystals. The size of an arrow indicates the relative on or off rates of MP components during the amorphous phase or after initiation of MP assembly during crystal growth. Dashed arrows indicate the directions of crystal growth. (B) Flow chart for MP assembly at different SPBs from a cytoplasmic pool of MP components.

