
Figure 4.
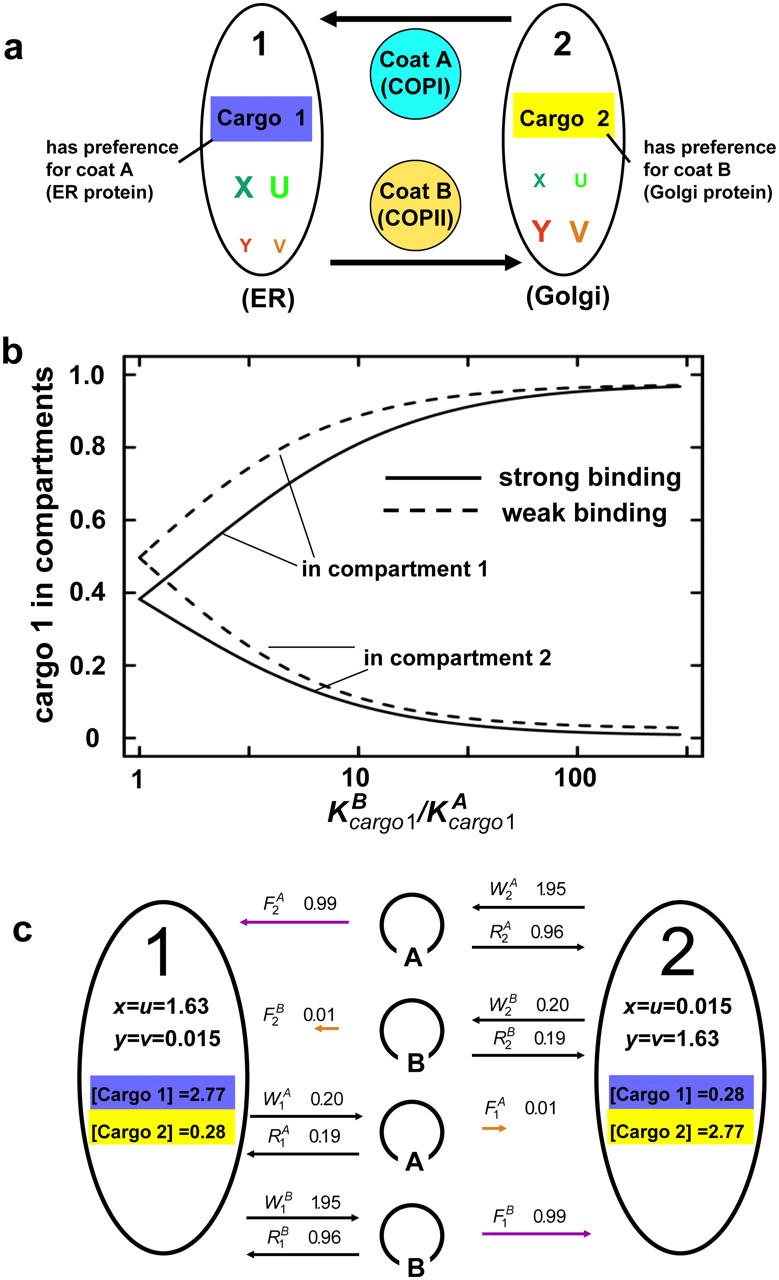
Cargo is distributed according to its affinity for coats. (a) Scheme illustrating that cargo with affinity for coat A accumulates in compartment 1, and cargo with affinity for coat B in compartment 2. These situations correspond to the localization of ER and Golgi proteins, respectively. (b) The amounts of cargo 1 in the two compartments are plotted versus the ratio  of dissociation constants for the two coats. The solid lines correspond to K
cargo 1
A=1 (strong binding), the dotted line to K
cargo 1
A=100 (weak binding). With a relatively small preference of cargo for one of the coats it can be greatly concentrated in one compartment, even when the absolute binding constant is low. (c) Steady-state concentrations and fluxes for a model in which cargo is required for vesicle budding (cargo 1 for the budding of coat B vesicles, and cargo 2 for the budding of coat A vesicles). The steady-state concentrations of SNAREs X, U, Y, and V (x, u, y, and v), of cargo 1 and 2 (in blue and yellow, respectively), and the vesicle fluxes (normalized so that the sum of net forward fluxes equals unity) were calculated for q = 100 as in Fig. 2 c. The different fluxes are defined as in Fig. 2 c. Note that the rates of futile budding and fusion of coat A vesicles from compartment 1 and of coat B vesicles from compartment 2 are significantly reduced compared with those in Fig. 2 c. Other parameters were as follows:
of dissociation constants for the two coats. The solid lines correspond to K
cargo 1
A=1 (strong binding), the dotted line to K
cargo 1
A=100 (weak binding). With a relatively small preference of cargo for one of the coats it can be greatly concentrated in one compartment, even when the absolute binding constant is low. (c) Steady-state concentrations and fluxes for a model in which cargo is required for vesicle budding (cargo 1 for the budding of coat B vesicles, and cargo 2 for the budding of coat A vesicles). The steady-state concentrations of SNAREs X, U, Y, and V (x, u, y, and v), of cargo 1 and 2 (in blue and yellow, respectively), and the vesicle fluxes (normalized so that the sum of net forward fluxes equals unity) were calculated for q = 100 as in Fig. 2 c. The different fluxes are defined as in Fig. 2 c. Note that the rates of futile budding and fusion of coat A vesicles from compartment 1 and of coat B vesicles from compartment 2 are significantly reduced compared with those in Fig. 2 c. Other parameters were as follows:
K cargo 1 A=K cargo 2 B=1, K cargo 1 B=K cargo 2 A=10,
w A=w B=0.3, κ=40.
The normalized sizes of compartments (Si/S; i = 1, 2), and of the vesicle populations  =
= , and
, and  =
= were 0.30, 0.002, and 0.20, respectively.