
Figure 3.
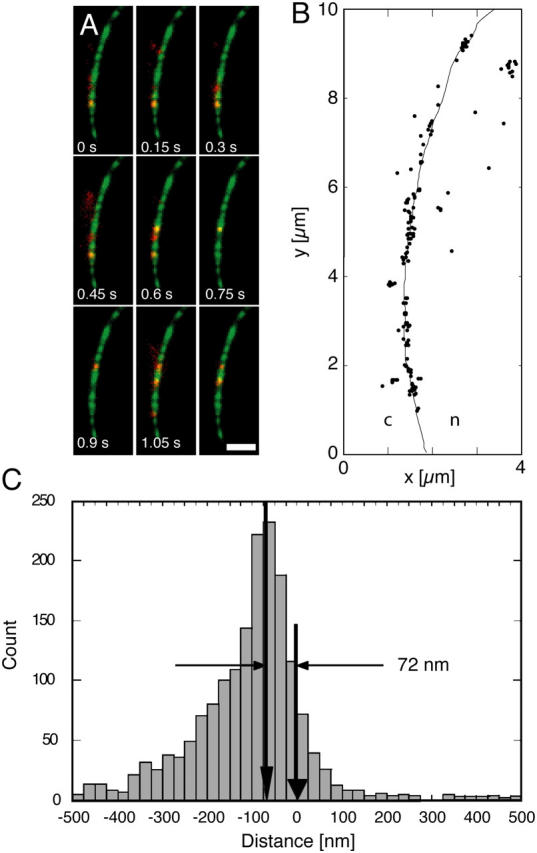
Observation of single antibodies at the NE. (A) Single frames of a video sequence showing the binding of secondary Alexa633-labeled antibodies (red spots) to preincubated αNup358 in the equatorial plane of a HeLa cell nucleus. An image of GFP-POM121 was acquired before movie acquisition and overlaid by the red channel image data. It was possible to visualize the binding of individual fluorescent antibodies to their NPC-bound epitopes one at a time. Images were smoothed using a 5 × 5 Gaussian kernel with a SD of 1 pixel and contrasted for display (integration time, 50 ms; frame rate, 6.67 Hz). Bar, 2 μm. (B) Plot of all antibody positions determined in the complete video sequence (400 images). The solid line shows the positions of the GFP-POM121 indicating the NE (c, cytoplasm; n, nucleoplasm). (C) Frequency histogram of the αNup358 binding sites in relation to the respective nearest point of the NE (defined as zero). The histogram has a distinct maximum at d = −72 ± 10 nm (left arrow). The data clearly demonstrate that Nup358 is located at the tips of the cytoplasmic filaments.