Figure 1.
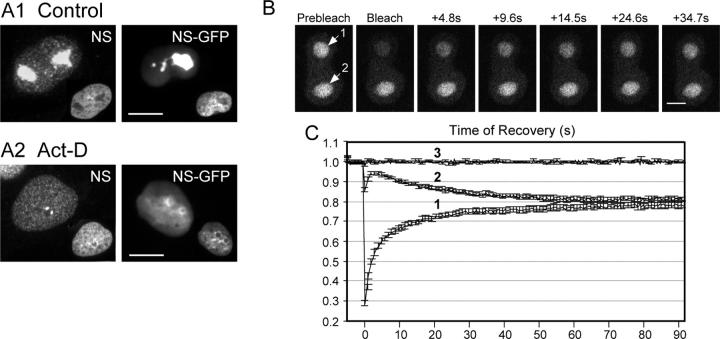
NS cycles between the nucleolus and the nucleoplasm. (A) Endogenous NS and expressed NS-GFP fusion protein display a nucleolar distribution in control cells (A1), and a nucleoplasmic distribution plus intense signals surrounding the nucleolar region in Act-D–treated CHO cells (A2). Inset: DAPI nuclear staining of the same cells. Bars, 10 μm. Time-sequenced images (B) and quantitative analyses (C) of FRAP (label 1) and iFRAP (label 2) on NS-GFP–transfected CHO cells with two nucleoli. After subtraction of the background signal, the relative intensities were normalized to the nonbleached signals in different cells, recorded in parallel, and shown in line 3 (C). Data were averaged over 20 cells in three independent experiments. Y-error bars represent SEM, omitted at every other data point for clarity. Bar, 4 μm.

