Figure 3.
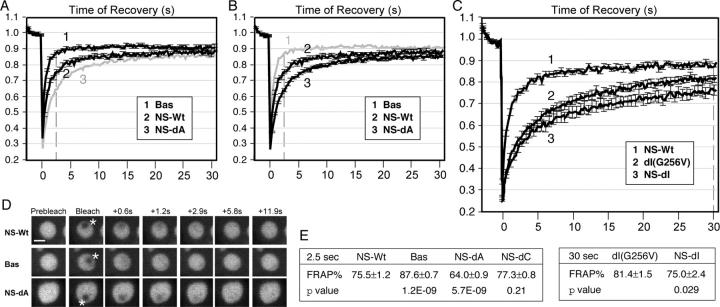
The long-term association of NS in the nucleolus is regulated by the I- and A-domains, and the binding of guanine nucleotide. (A and B) Quantitative data of FRAP analyses of the B-domain alone (Bas, trace 1), the wild-type NS (NS-Wt, trace 2), and the A-domain deletion (NS-dA, trace 3) in CHO cells. Y-error bars represent SEM and are omitted at every other data point for clarity. For comparison, Bas and NS-dA were shown in B and A in gray without error bars. (C) FRAP analyses of dI(G256V) (trace 2) and NS-dI (trace 3), compared with the wild-type NS (trace 1). Dotted lines in A–C indicate the points of analysis. (D) Time-sequenced FRAP images of NS-Wt, Bas, and NS-dA mutants before and after photobleaching. Bar, 4 μm. A 1.5-μm-diameter circle (marked by asterisks) within the nucleolus was bleached and the signal recovery was recorded over a period of 31.5 s. (E) T-test analyses of the FRAP results of wild-type and mutant NS-GFP fusion protein (mean ± SEM, n = 20) were conducted at 2.5 s (left) or 30 s (right) after photobleaching.

