Figure 8.
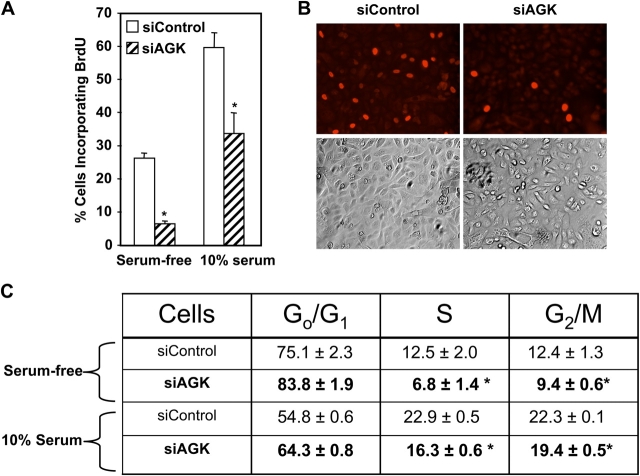
Involvement of endogenous AGK in cell proliferation. (A) PC-3 cells were transfected with control siRNA (open bars) or siAGK (hatched bars) and serum starved for 8 h. After culturing for an additional 16 h in serum-free medium or in medium supplemented with 10% serum, BrdU was added for 3 h and the fraction of cells incorporating BrdU was determined. Data are means ± SD of duplicate cultures from a representative experiment. At least three different fields were scored with a minimum of 100 cells per field. Similar results were obtained in two independent experiments. (B) Representative fluorescent and phase images of siControl and siAGK-transfected cells. (C) Cell cycle analysis. PC-3 cells transfected with control siRNA or siAGK were cultured in serum-free medium or in medium supplemented with 10% serum. After 24 h, cellular DNA was stained with propidium iodide and cell cycle analysis was performed with an Epics XL-MCL flow cytofluorometer (Beckman Coulter). Asterisks indicate significant differences from vector-transfected values as determined by t test (P ≤ 0.05).

