
Figure 3.
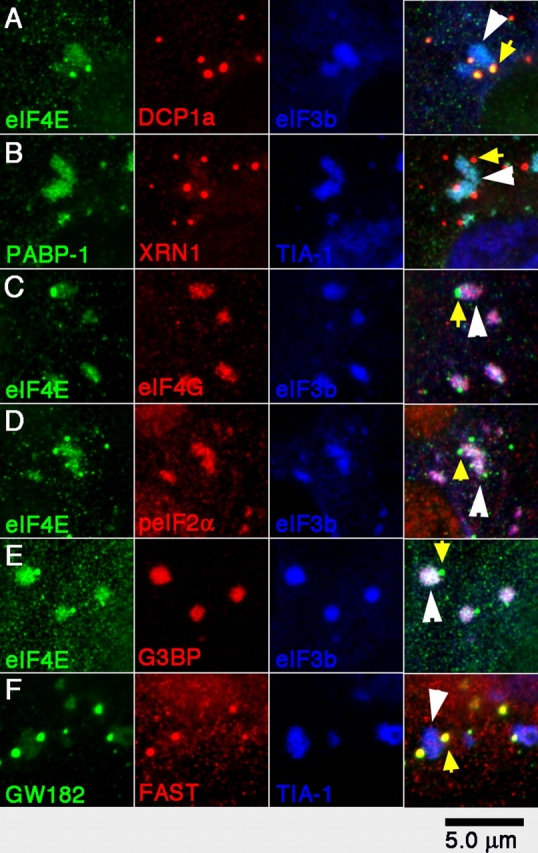
Distribution of proteins between arsenite-induced SGs and PBs. SGs were induced in DU145 cells by arsenite treatment, and cells were triple stained for the indicated proteins: (A) eIF4E, DCP1a, and eIF3b; (B) PABP-1, XRN1, and TIA-1; (C) eIF4E, eIF4G, and eIF3b; (D) eIF4E, phospho-eIF2α, and eIF3b; (E) eIF4E, G3BP, and eIF3b; and (F) GW182, FAST, and TIA-1. Yellow arrows indicate representative PBs; white arrowheads indicate SGs in the merged views.