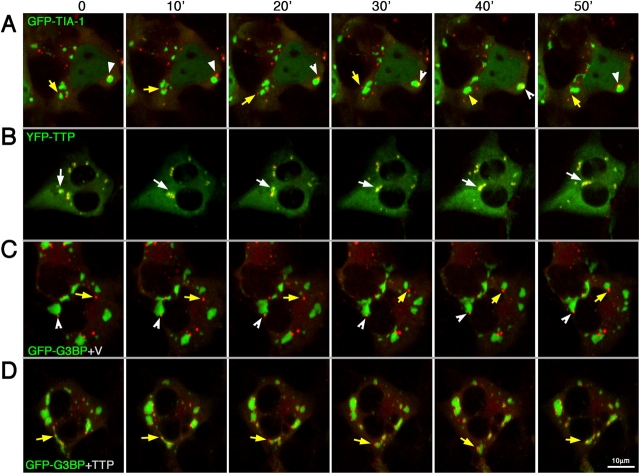
Figure 7.
Dynamics of SGs and PBs in vivo. COS7 cells cotransfected with RFP-DCP1a and either (A) GFP–TIA-1, (B) YFP-TTP, (C) GFP-G3BP plus empty myc-vector, or (D) GFP-G3BP and TTP-myc. Cells were observed at 37°C in real time by using confocal microscopy. Images from 10-min intervals are shown; Videos 1–5 depicts animation of these series (available at http://www.jcb.org/cgi/content/full/jcb.200502088.DC1). Each image is volume rendered from 10 Z-sections. Yellow arrows indicate PBs; white arrowheads indicate SGs.

