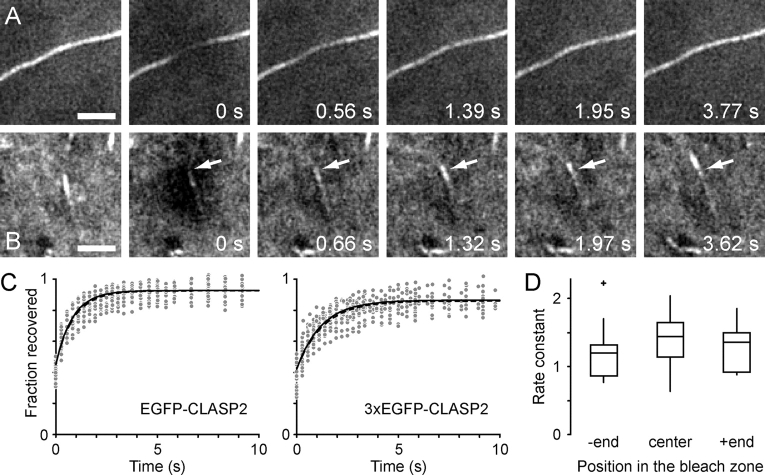
Figure 3.
Photobleaching of EGFP-CLASP2 on MT lattices and growing plus ends. (A) FRAP of EGFP-CLASP2 on the MT lattice in the lamella (Video 4). Fluorescence recovers evenly in the entire bleached region. Bar, 2 μm. (B) FRAP of EGFP-CLASP2 on a growing plus end in the cell body. The arrow indicates the position of the terminus of CLASP fluorescence near the MT plus end at the time of bleaching. Note that recovery occurs transiently proximal to this site before the plus end comet treadmills away from its initial position. Bar, 2 μm. (C) Graphs of relative fluorescence recovery on MT lattices showing all data points, the average of exponential fits from individual experiments (n = 20; solid line) and the direct exponential fit of all data (dashed line). (D) Comparison of the recovery rate constant of EGFP-CLASP2 on MT lattices determined either in the center or toward either side of the bleached region. No significant difference could be detected by ANOVA. Data are presented as box-and-whisker plots indicating the 25th percentile (bottom boundary), median (middle line), 75th percentile (top boundary), nearest observations within 1.5 times the interquartile range (whiskers), and outliers (+).

