
Figure 6.
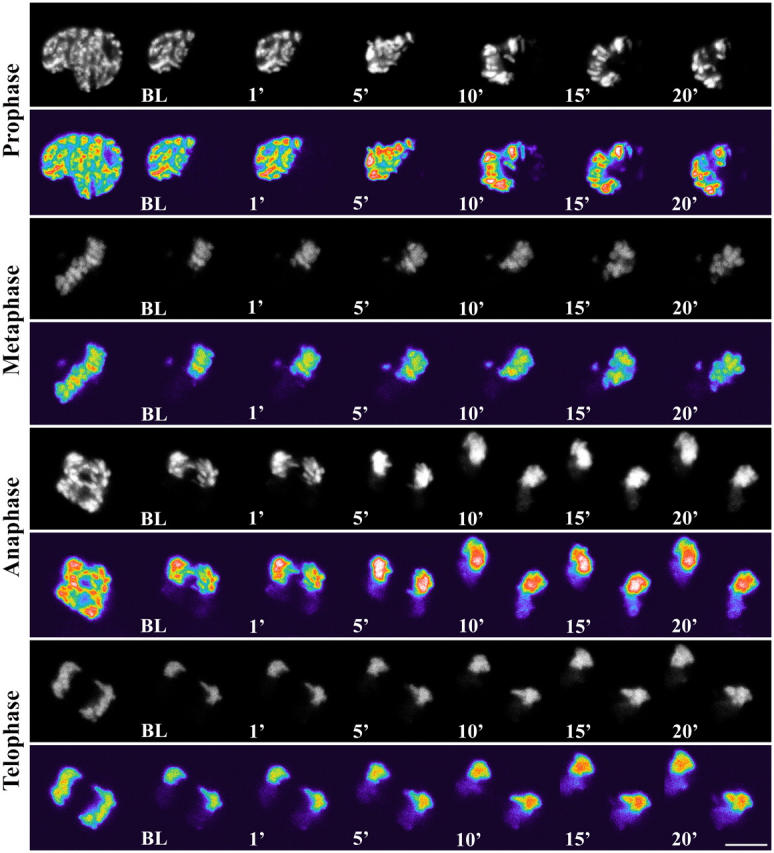
FRAP analyses of H2B-GFP at all phases of mitosis. Cells were imaged before and during recovery after bleaching of chromosome area. For each M phase cell, top panel represents original images, bottom panel represents pseudocolored images. Bar, 10 μM.