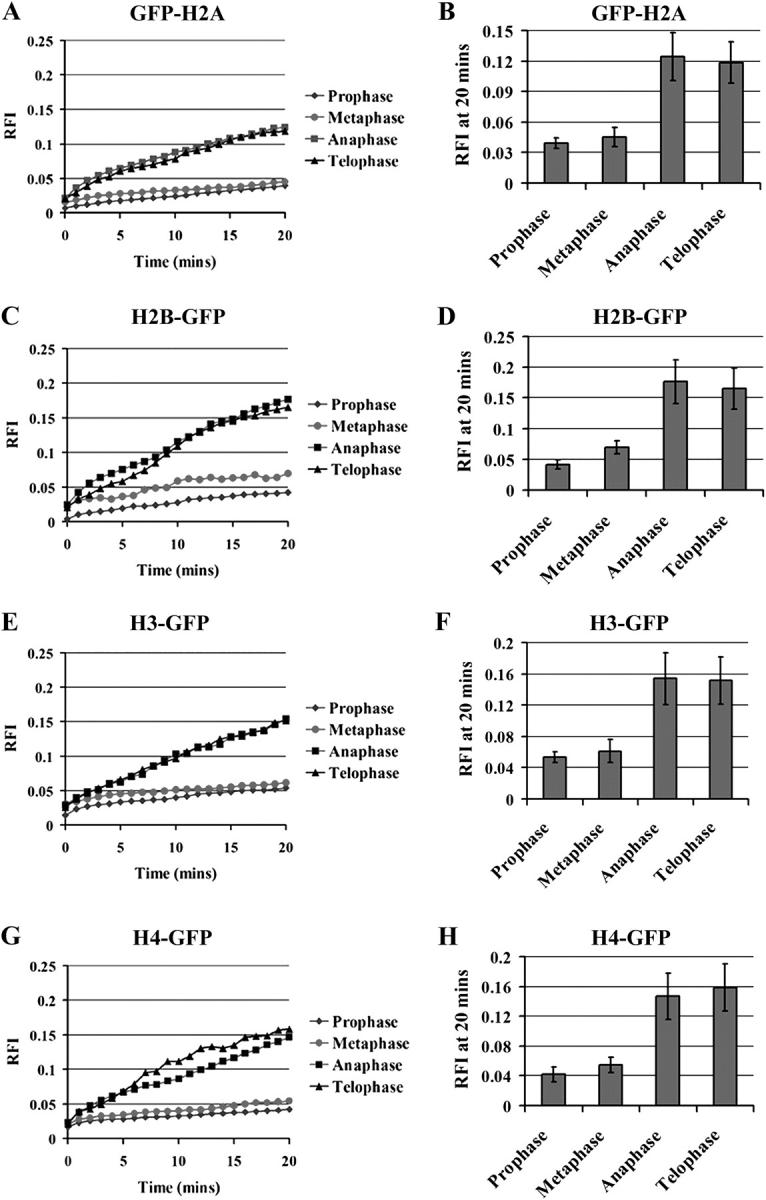
Figure 7.

FRAP analyses of core histones at all phases of mitosis. Quantification of the fluorescence recoveries through changes in RFI over time for GFP-H2A, H2B-GFP, H3-GFP, and H4-GFP, correspondingly. Error bars represent averages from 10 cells ± SD.
