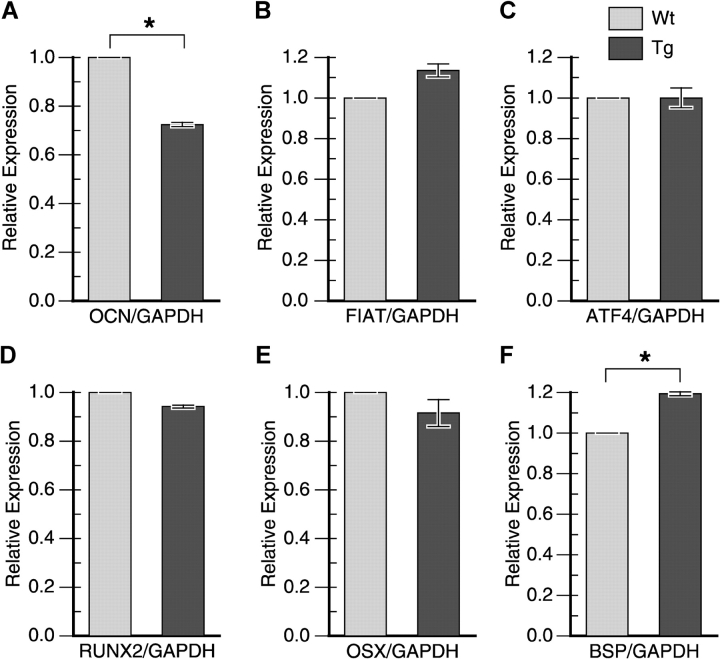
Figure 8.
Expression of osteoblast expression markers. RNA was extracted from 3-mo-old calvaria, reverse-transcribed, and amplified with specific TaqMan probes using real-time PCR. Relative expression between wild-type (Wt) and transgenic (Tg) animals was calculated by the relative standard curve method and normalized to GAPDH. *, P < 0.05.

