
Figure 2.
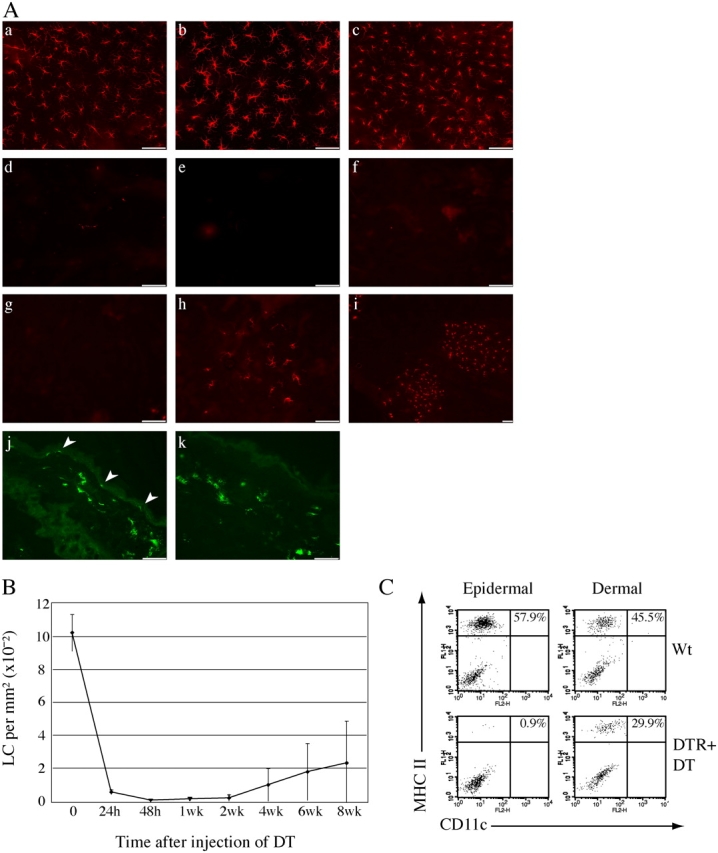
Efficient and specific ablation of LC from Langerin-DTR mice. (A) Epidermal sheets were separated from mouse ears and stained for MHCII to visualize LC: (a) wt; (b) wt + DT (72 h); (c) Langerin-DTR. Mutant mice were subsequently injected i.p. with DT and LC visualized to determine the kinetics of depletion and repopulation; (d) 24 h; (e) 48 h; (f) 2 wk; (g–i) 4 wk. Pictures are representative of four different mice for each time point, γ adjustments were made to reduce background on epidermal sheets. Cross sections through ear skin were stained with MHCII to demonstrate selective depletion of LC and an intact dDC compartment after DT. (j) Langerin-DTR; (k) DTR + DT (24 h). Arrowheads identify MHCII+ LC in the epidermis. Bars, 50 μm. (B) Quantification of depletion and repopulation of LC after injection of DT. Numbers of MHCII+ LC were counted using a gridded eyepiece with the 40× objective. 20 fields of evenly spaced cells were counted from four different mice for each time point. At 6 wk after injection of DT, LC numbers are still significantly decreased compared with wt mice (Mann-Whitney test wt vs. Langerin-DTR mice at 6 wk: P = 0.0286). Error bars represent SD. (C) LC but not dDC are ablated in Langerin-DTR mice. Emigrant cells from the epidermis or dermis of wt and Langerin-DTR mice injected with DT 48 h earlier were analyzed by flow cytometry. Numbers show the percentage of CD11c/MHCII double-positive cells, FACS plots are representative of three separate experiments.