
Figure 3.
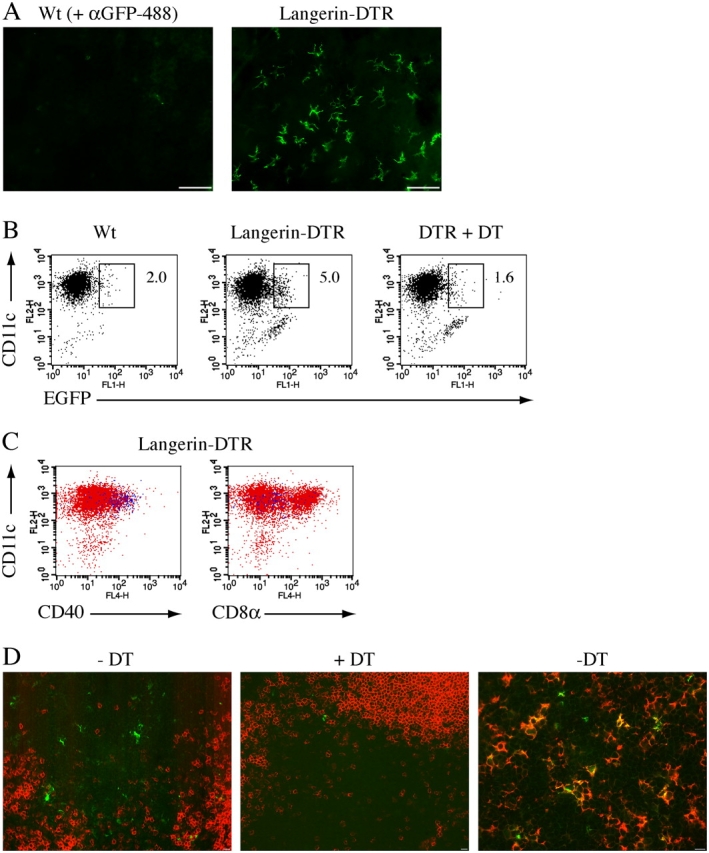
EGFP expression in Langerin-DTR mice. (A) Expression of EGFP in Langerin-DTR epidermal sheets. Visualization of EGFP expression was enhanced by incubation of an anti–GFP-488 antibody, which specifically labeled cells from Langerin-DTR mice. Bars, 50 μm. (B) EGFP expression in skin draining LN. CD11c+ LN cells from wt, Langerin-DTR, and Langerin-DTR mice injected with DT (48 h) were enriched and analyzed for EGFP expression, 3.34% ± 0.375 (mean ± SEM, n = 4) of LN cells were gated EGFP-positive compared with 1.47% ± 0.121 (n = 4) background fluorescence in wt mice. Mann-Whitney test wt vs. Langerin-DTR, P = 0.0159. FACS plots are representative of four different experiments. (C) Cells from Langerin-DTR mice were analyzed for expression of surface markers and CD11c. Blue dots are gated EGFP+ cells from B. Plots are representative of at least five different experiments. (D) LNs from Langerin-DTR mice or Langerin-DTR mice injected with DT for 48 h were sectioned and analyzed for the presence of EGFP+ LC. All sections were stained with anti–GFP-488 in addition to anti-B220 (a and b) or anti-MHCII (c) to demarcate B and T cell areas, respectively. Bars, 10 μm.