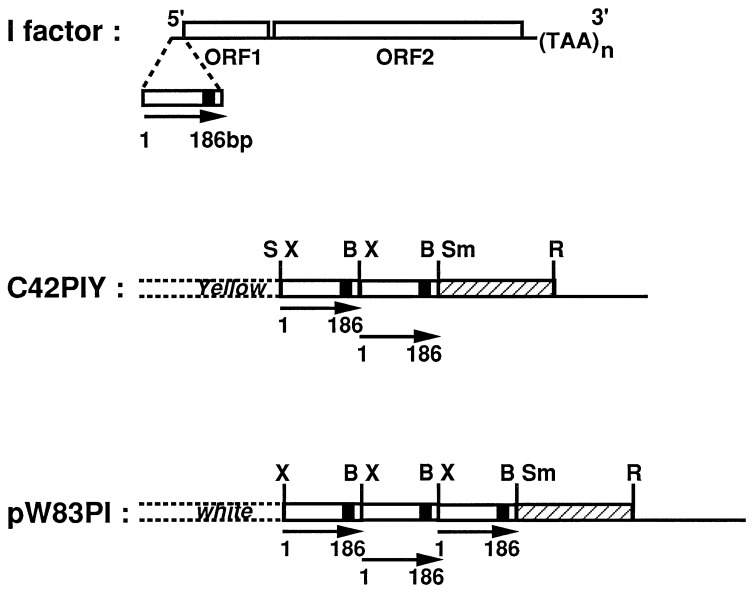
Figure 1.
Maps of the constructs C42PIY and pW83PI. The structure of the complete I factor showing the two ORFs (ORF1 and ORF2) is shown with the 5′-UTR expanded below. The position of site 1 is indicated in black. The regions of C42PIY and pW83PI containing the 5′-UTR are illustrated as well as adjacent regions of the yellow and white genes and the CAT reporter gene (striped box). The position of site 1 is indicated by the black box. B, BamHI; R, EcoRI; S, SalI; Sm, SmaI; X, XbaI.

