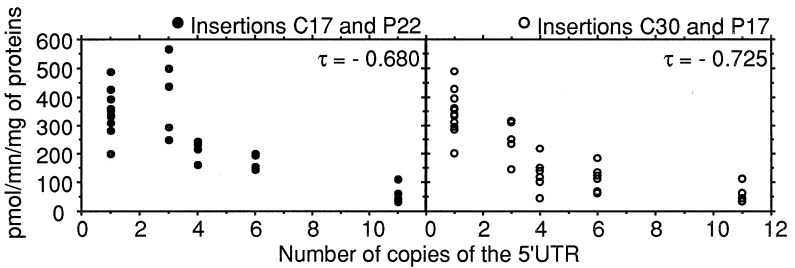
Figure 2.
The effect of increasing doses of the 5′-UTR on the activity of the I factor promoter. The vertical axis indicates the CAT activity (pmol/min/mg of protein) in extracts of ovaries from females obtained as indicated below. The horizontal axis indicates the number of copies of the 5′-UTR per haploid genome. Females of strains with 0, 2, 3, 5, or 10 copies of the 5′-UTR per haploid genome were crossed with males carrying the 1–186:CAT reporter gene. This gave progeny with 1, 3, 4, 6, or 11 copies of the 5′-UTR per haploid genome. The black circles indicate the results of crosses using females of strains C17H, P22H, and C17P22H whereas the white circles indicate the results for strains C30H, P17H, and C30P17H. The final point (11 copies) was obtained by using females of strain C17P22C30P17H (Table 1).

