
Figure 4.
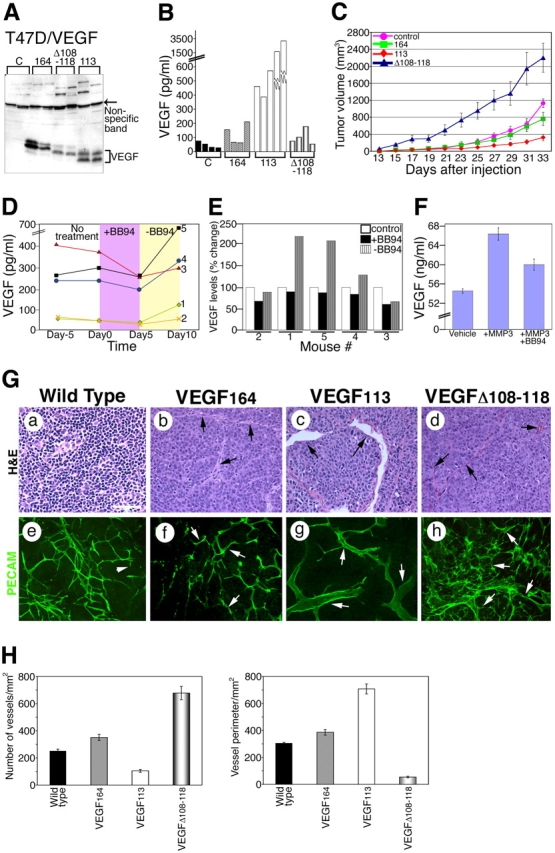
Induction of tumor growth in the presence of mVEGF 164 , mVEGF113, and mVEGF Δ 108–118. (A) Tumor lysates were immunoblotted with antibody 463. VEGF is indicated by a bracket. A nonspecific band (arrow) illustrates relative loading levels. Above this band, high molecular mass proteins were also immunoreactive. (B) Serum levels of VEGF in the different groups of mice bearing xenografts. (C) Tumor growth kinetics. Estimated volume was calculated using the following formula: volume (mm3) = 4/3π(0.5 × w)2 × (0.5 × l), where w is the width and l is the length. Results are mean ± SD. n = 8 for control, 164, and Δ108–118; n = 13 for 113. (D) Effect of treatment with MMP inhibitor BB94 on circulating serum levels of VEGF (n = 5). Each line corresponds to one mouse. VEGF measurements were performed 5 d before treatment (Day −5), immediately before treatment (Day 0), 5 d after treatment (Day 5), and 5 d after BB94 withdrawal (Day 10). (E) Percent change in VEGF levels from day 1 (1 d before the treatment with BB94). (F) VEGF levels in conditioned media of MMP3-treated and nontreated tumor explant cultures. Explants were incubated in the presence of vehicle, MMP3, and MMP3 + BB94. Levels of VEGF were determined by ELISA. (G) Microscopic analyses of tumor sections by hematoxylin and eosin (H&E) and platelet/endothelial cell adhesion molecule 1 (PECAM) staining. A representative tumor section of each mouse group is shown. Arrows point to vessels in b–h. Arrows in e–h indicate PECAM-positive vessels. Bar, 100 μm. (H) Quantitation of vascular density and size. (C, F, and H) Error bars are ±SD.