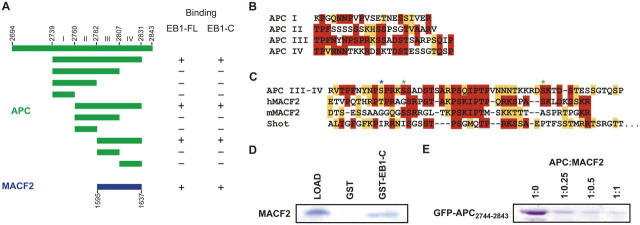
Figure 1.
Delineation of the EB1–APC and EB1–MACF2 interaction regions. (A) Summary of EB1 binding assays. APC constructs are delineated in green, MACF2 in blue. (B) Alignment of APC repeat regions I–IV. Identity is indicated in red, homology in orange. (C) Alignment of the EB1 binding motif of human APC, human MACF2, murine MACF2, and Drosophila Shot, with conservation colored as in B. Asterisks denote tentative PKA (green) and CDC2 (blue) phosphorylation sites. (D) Coomassie-stained polyacrylamide gel showing MACF21595-1637 retention on a GST-EB1185-255 column. (E) GFP-APC2744-2834 and MACF21596-1637 compete for binding to GST-EB1185-255. 10 μl GST-EB1185-255–bound glutathione Sepharose beads were preincubated with 0, 138, 225, and 550 nmol MACF21595-1637 for 30 min before incubation with 550 nmol GFP-APC2744-2842 for an additional hour. Resin was washed three times in batch with wash buffer, and the amount of bound GFP-APC2744-2843 was analyzed by Coomassie-stained SDS-PAGE.

