Figure 1.

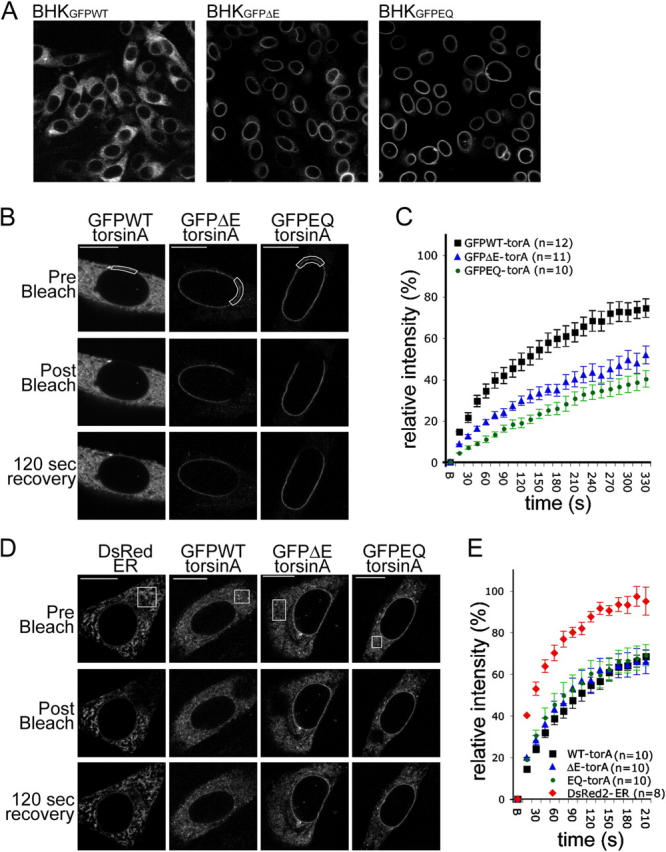
Pathogenic and substrate trap forms of torsinA display reduced mobility in the NE. (A) GFP immunolabeling of BHKGFPWT, BHKGFPΔE, and BHKGFPEQ stable cell lines. (B and D) GFP fluorescence of BHK21 cells transiently transfected with GFPWT-, GFPΔE-, or GFPEQ-torsinA and DsRed fluorescence of control cells transfected with DsRed2-ER (CLONTECH Laboratories, Inc.). Images show representative cells immediately before (top), immediately after (middle), and 120 s after (bottom) bleaching a ROI (boxed areas) in the NE (B) or ER (D). Bars, 10 μm. (C and E) Relative fluorescence intensity in the ROI as a function of time after photobleaching at time point “B” (B, bleach; see Materials and methods). Points show mean values and SEM.
