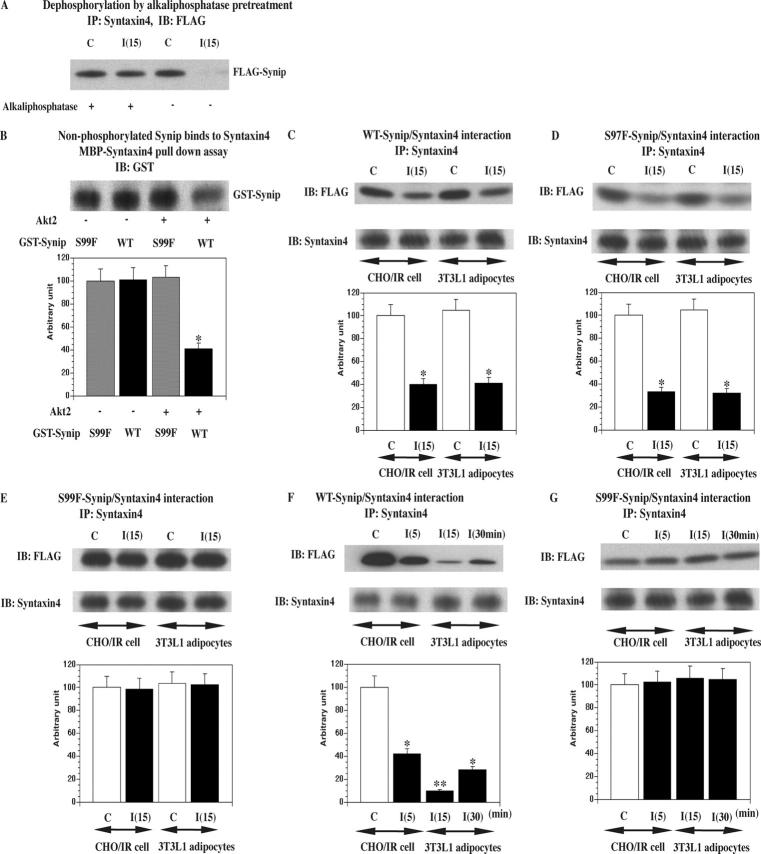
Figure 3.
Synip phosphorylation is required for Synip dissociation from Syntaxin4. (A) In this experiment whole cell lysates were pretreated with alkaline phosphatase first as described previously (Zhao et al., 1998) to dephosphorylate all the phosphorylated molecules. Thereafter, an ordinal coimmunoprecipitation experiment was conducted to see Synip–Syntaxin4 interaction. These are representative experiments independently performed two times. (B) Either GST-WT-Synip or GST-S99F-Synip was phosphorylated by Akt2 first and then incubated with MBP-Syntaxin4. Samples were separated on SDS-PAGE and GST-Synip associated with MBP-Syntaxin4 was estimated by GST immunoblot (*, P < 0.01). These were repeated five times. In addition, we stripped the GST antibody from filters and reprobed them with phosphospecific Akt substrate antibody. We confirmed that there was no signal (not depicted) and that nonphosphorylated Synip binds to Syntaxin4. (C–E) FLAG-WT-Synip or FLAG-S99F-Synip or FLAG-S97F-Synip was electroporated to CHOIR cells and 3T3L1 adipocytes and the cells stimulated with or without insulin for 15 min. In these experiments, the amount of expressed Synip protein was adjusted to match the expression levels in 3T3L1 adipocytes that have a lower level of transfection efficiency and protein expression than CHOIR cells (Min et al., 1999). In comparison to Fig. 1, 8 mg of detergent whole cell lysates were immunoprecipitated with 4 μg of Syntaxin4 antibody. Coimmunoprecipitated Synip amount was estimated by FLAG immunoblotting. FLAG-WT-Synip and FLAG-S97F-Synip dissociation could be observed in CHOIR cells and 3T3L1 adipocytes. The difference in band intensity was statistically significant (*, P < 0.05). These are representative experiments independently performed four times. (F and G) FLAG-WT-Synip or FLAG-S99F-Synip was electroporated to CHOIR. After Syntaxin4 was immunoprecipitated, coimmunoprecipitated Synip amount was estimated by FLAG immunoblotting. FLAG-WT-Synip dissociation appeared 5 min after insulin stimulation and continued up to 30 min. The difference in band intensity was statistically significant (*, P < 0.05; **, P < 0.01). These are representative experiments independently performed three times. In this design, insulin stimulation was done at 5, 15, and 30 min.

