Figure 1.
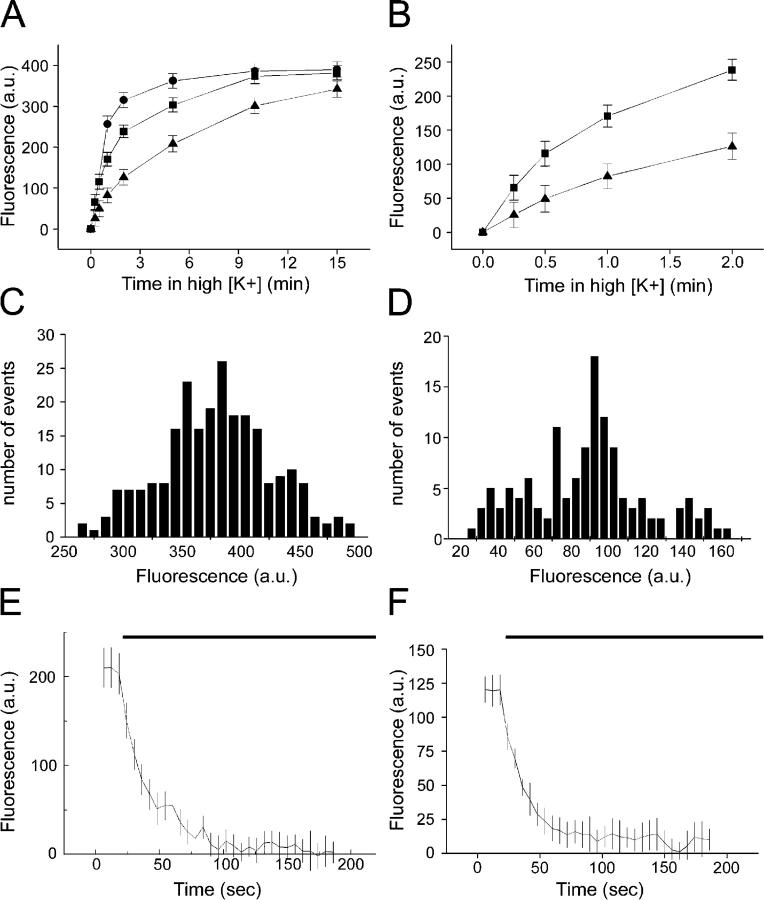
Loading different fractions of the cycling vesicle pool at hippocampal boutons. Data are from four to six coverslips per treatment, and >100 boutons were analyzed. (A) Comparison of the uptake of 4 μM FM1-43 by boutons when stimulated for varying lengths of time in either 25 (triangles), 40 (squares), or 70 mM K+ (circles). (B) Expansion of the first 2 min of A. (C) Distribution of fluorescence intensities of maximally loaded boutons. (D) Distribution of fluorescence intensities of boutons containing only three to eight labeled vesicles (25 mM K+ for 1 min). Note the absence of clear quantal peaks. (E) Destaining kinetics of maximally loaded boutons stimulated with 70 mM K+ during the time indicated by the bar. (F) Destaining kinetics of weakly loaded boutons stimulated with 70 mM K+ during the time indicated by the bar. Note that E and F were obtained using different settings, so the y-axes are not comparable.

