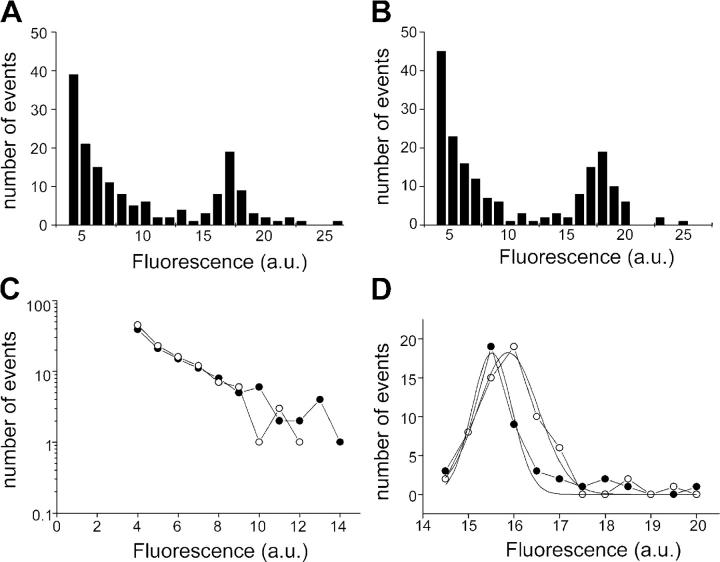
Figure 3.
The distribution of fluorescence steps reveals two populations of events. (A and B) Two separate sets (batches of cultures, four to six coverslips each) of pooled events analyzed for the extent of fluorescence decline in individual steps. A similar distribution is seen in each case. (C) The events of smaller amplitude (<14 units) are linear on a semi-log plot, indicating that they can be described by a single exponential distribution. Closed circles are data from A, open circles are data from B. (D) Larger amplitude events (>14 units) show a normal distribution with a peak around 16 units. Closed circles are data from A, open circles are data from B.

