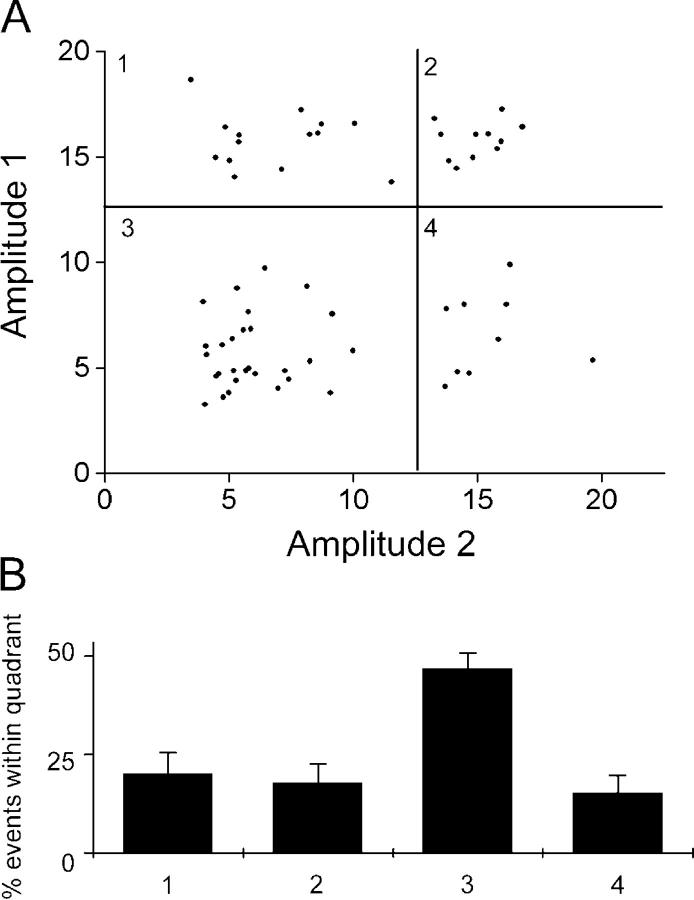
Figure 4.
Traces from individual boutons show both large and small events. (A) 62 boutons showing at least two events were analyzed. The amplitude of the first stepwise destaining event was plotted against that of the second. Large and small events were distinguished by a threshold of 14 fluorescence units, indicated by the bold lines; this separated events into four quadrants, numbered 1 through 4, which were then quantified in B. (B) Events were seen in all four quadrants from A. Quadrant 3, small events followed by a second small event, was the most prominent, but occurred in line with the greater proportion of small events seen under these conditions. Overall, the expected distribution would be Q3 > Q1 = Q4 > Q2, and it is not significantly different from this, although the difference between Q3 and the other quadrants is the only one that is significantly different. Error bars are SEM.

