
Figure 6.
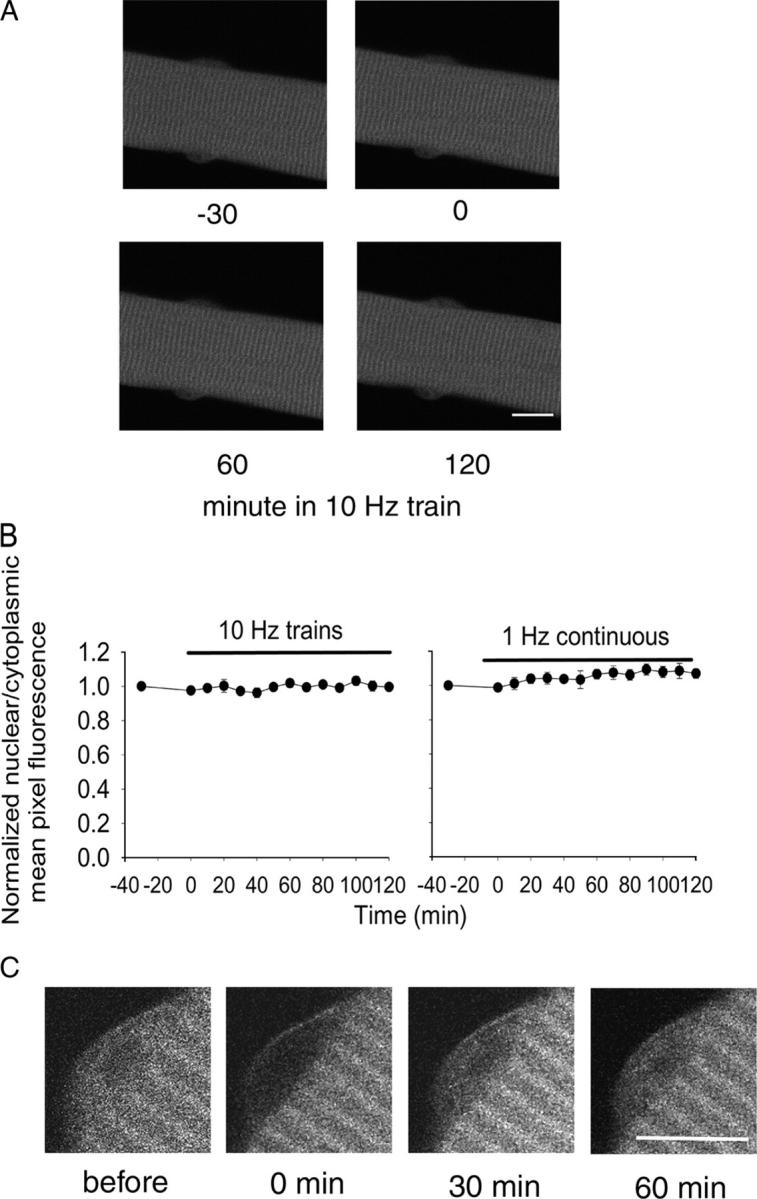
The subcellular distribution of CaM-YFP was not changed by 10- or 1-Hz electrical stimulation. (A) A typical living fiber expressing CaM-YFP is shown for 30 min (−30 and 0) before stimulation and 60 and 120 min after repetitive stimulation with 10-Hz trains. In resting fibers, CaM-YFP was present in the cytoplasm as well as the nucleus. (B) The fluorescence signals from both the nucleus and the cytoplasm were quantitated. Data are presented as the ratio of the average fluorescence intensity per pixel from the nucleus relative to the cytoplasm. Neither 10-Hz train stimulation (left) for 2 h nor 1-Hz continuous stimulation (right) resulted in any subcellular redistribution of CaM-YFP. (C) FRAP of CaM-YFP was performed in the nuclear area of a muscle fiber. Shown is a nucleus before photobleaching, immediately after photobleaching, and after 30 and 60 min of recovery. The entire nuclear region was selectively bleached. Bars, 10 μm.