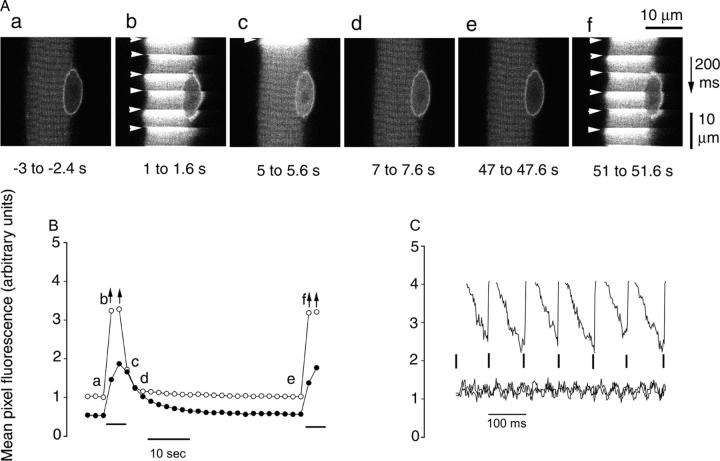
Figure 7.
Calcium concentration is elevated in both the nucleus and cytoplasm during repetitive electrical stimulation. (A) A fiber was repetitively stimulated every 50 s with a 5-s duration train of pulses at 10 Hz. Calcium-dependent fluo-4 fluorescence images taken in x-y scan mode in the resting “control” condition before the start of repetitive stimulation (a), 1–1.6 s after the start of the first train (b), 0–0.6, 2–2.6, and 42–42.6 s after the first train (c–e), and 1–1.6 s after the start of the second train (f). The notched appearance at the edge of the fiber in panels b and f is due to individual nonfused fiber contraction at each stimulus. The nuclear Ca2+ concentration was still elevated compared with the rest a few hundred milliseconds after the end of the 5-s train (c). Arrowheads indicate the application of each stimulus within an image. Note that each image was scanned from top to bottom at 0.05 μm/ms. (B) Time course of nuclear (closed circles) or cytosolic (open circles) mean pixel fluorescence in the central 100 μm (recorded during 200 ms) of images in A and others not depicted. Arrows indicate underestimation of mean pixel fluorescence due to the inclusion of pixels maxed out due to detector saturation. Horizontal bars below records mark duration of the 5-s 10-Hz trains of stimuli. (C) Time course of cytoplasmic fluorescence from individual images (i.e., from top to bottom) during stimulation (top; from A, b) and before and after stimulation (bottom; from A, a and e). Vertical lines mark times of individual stimuli.

