
Figure 4.
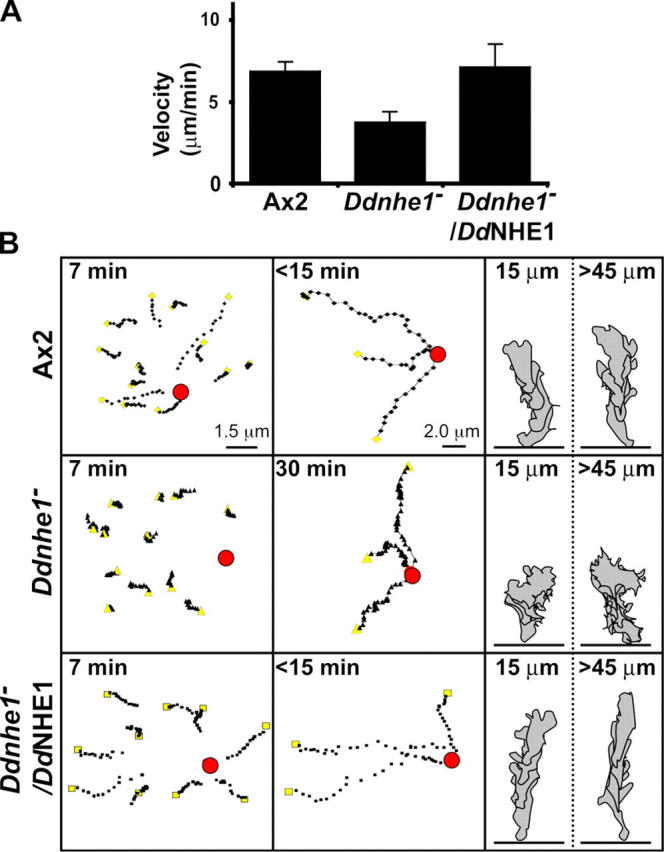
Ddnhe1 − cells chemotax toward cAMP but inefficiently and with decreased velocity. (A) The velocity of Ax2 and Ddnhe1 − /DdNHE1 cells was similar (7 and 8 μm/min, respectively), whereas the velocity of Ddnhe1 − cells reduced by ∼35% (4 μm/min). Data are expressed as the mean ± SEM of three independent cell preparations. (B) Tracking of individual cells for 7 min after addition of cAMP indicated that Ax2 cells (top left) and Ddnhe1 − /DdNHE1 cells (bottom left), but not Ddnhe1 − cells (middle left), had moved toward the point source of chemoattractant. Yellow squares and triangles mark the starting positions of tracked cells. After 15 min, all Ax2 cells (top) and Ddnhe1 − /DdNHE1cells (bottom) within the field had reached the cAMP source, whereas Ddnhe1 − cells took 30 min or more (middle). Four sequential traces taken from images obtained at 30-s intervals were obtained for chemotaxing Ax2 (top right), Ddnhe1 − (middle right), and Ddnhe1 – /DdNHE1 (bottom right) cells. The location of the needle containing cAMP was initially either within 15 μm or >45 μm, as indicated, from the leading edge of the cell.