Figure 1.
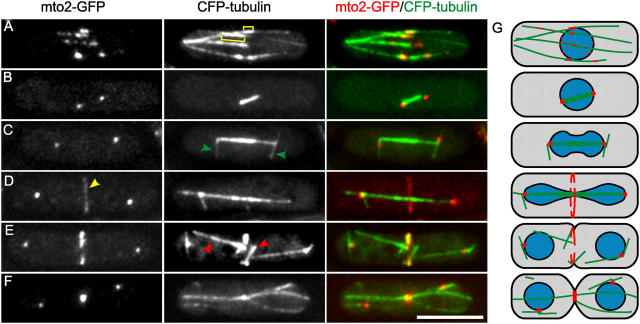
Localization of mto2-GFP to MTs. (A–G) Representative images of cells expressing mto2-GFP and CFP-tubulin (PT537). Imaging: projected deconvoluted wide-field images showing the complete cell depth. A delay of ∼20 s between the GFP and CFP image causes apparent nonperfect localization of mto2-GFP to MTs. (A) In interphase, mto2-GFP is localized primarily to the iMTOC regions of MT bundles that as a result of MT overlap are recognized by a brighter CFP signal (square brackets). (B–D) Mitotic spindles and astral MTs (green arrowheads) terminate at mto2-GFP rich SPBs. (D) Mto2-GFP is localized to the equatorial region (yellow arrowhead) before post-anaphase array MTs (red arrowheads) appear in E. (G) Cartoon of mto2-GFP localization and MT organization (Hagan, 1998). The nucleus is shown in blue. Bar, 5 μm.

