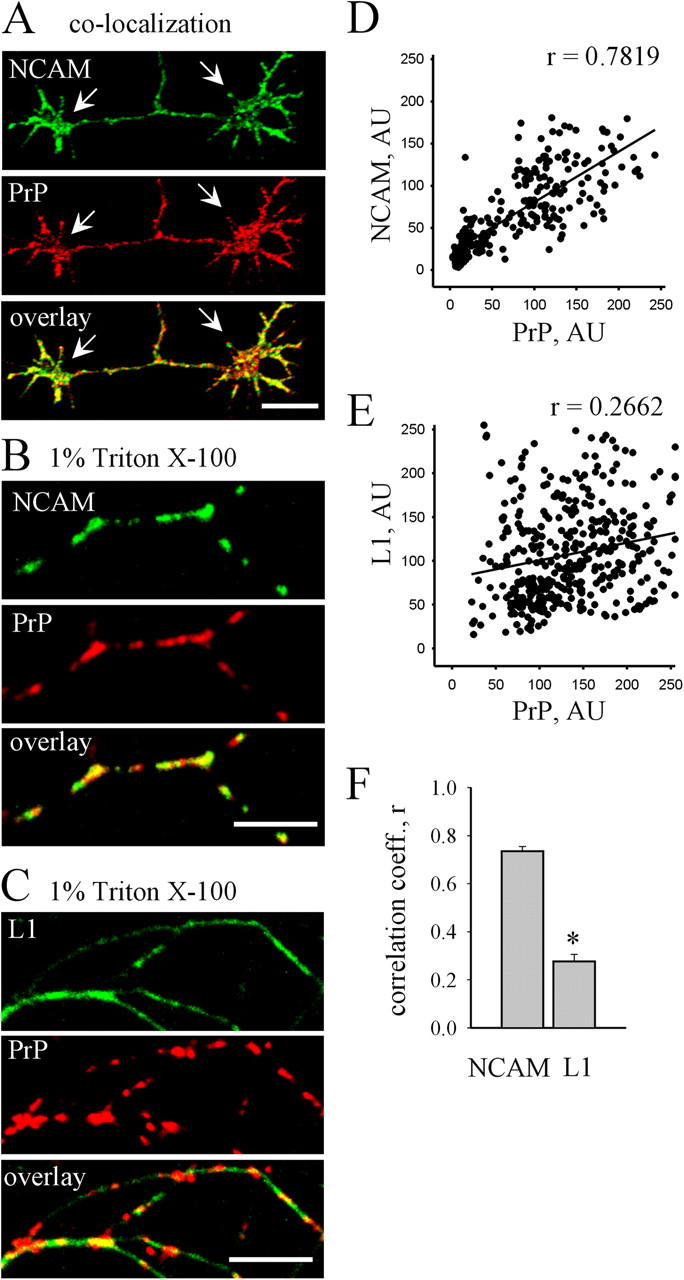
Figure 1.

NCAM colocalizes with PrP in lipid rafts. (A) Neurite with two growth cones (arrows) double-labeled with NCAM and PrP antibodies. PrP and NCAM partially colocalize along neurites and in growth cones. (B and C) Neurons were extracted in cold 1% Triton X-100 and labeled with PrP and NCAM antibodies (B) or PrP and L1 antibodies (C). Detergent-insoluble clusters of PrP overlap with accumulations of NCAM. L1 shows a distribution distinct from PrP. Bars, 10 μm. (D and E) Examples of linear regression graphs comparing distributions of PrP and NCAM (D) or PrP and L1 (E) are shown. Corresponding correlation coefficients (r) are presented. (F) The diagram shows mean correlation coefficients (r) comparing distributions of PrP and NCAM or PrP and L1. The correlation between localization of NCAM and PrP is significantly higher than between localization of L1 and PrP. Mean values ± SEM (n > 30) are shown. *, P < 0.05, t test.
