
Figure 4.
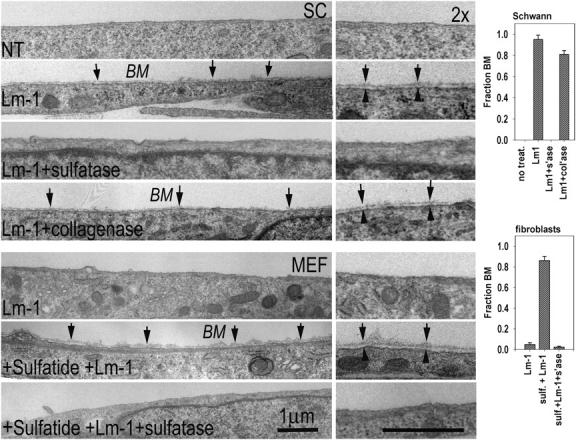
Ultrastructural evidence of cell-surface BM assembly. (top four panels) SCs were prepared for EM untreated (NT), treated with 20 μg/ml Lm-1 for 1 h, treated with Lm-1 in the presence of 50 U/ml arylsulfatase (sulfatase, s'ase), or treated with Lm-1 plus 250 U/ml of bacterial collagenase (col'ase). (bottom three panels) MEFs were treated with 40 μg/ml Lm-1 for 1 h, loaded with 10 μM sulfatide (sulf), and treated with Lm-1 or treated with Lm in the presence of arylsulfatase. Arrows indicate BM and arrowheads delimit plasma membrane. Cross sections through cells that are adhered to plastic with exposed cell surfaces are shown above. (right) Degree of BM coverage is determined from different cross-sectional levels (mean ± SEM; SCs, n = 3–4; fibroblasts, n = 5–7).