
Figure 1.
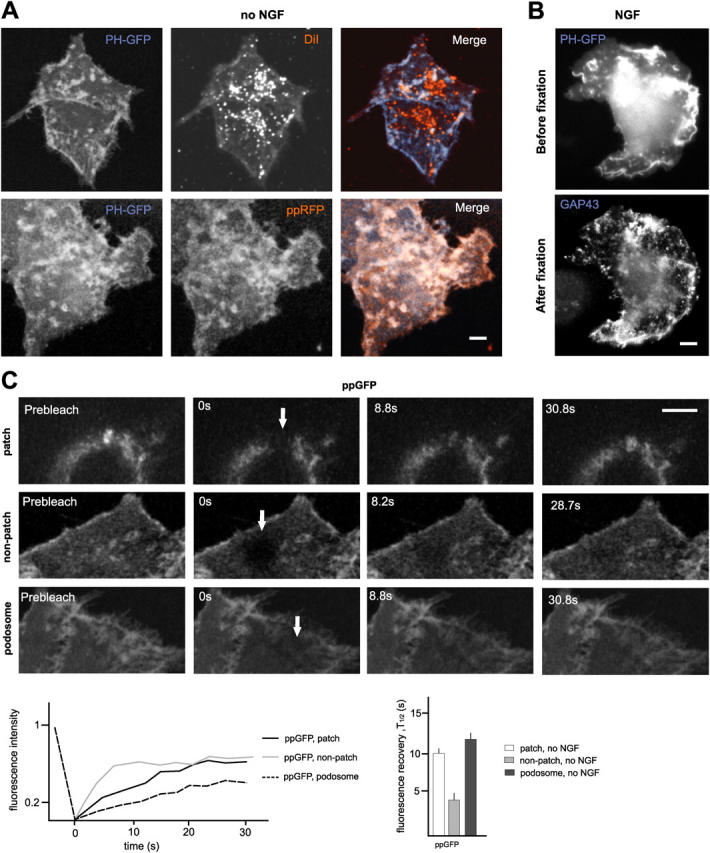
Visualization and FRAP-based validation of PI(4,5)P2-rich raft assemblies in living PC12 cells. (A) Visualization of PI(4,5)P2-rich raft assemblies in living cells. (Top) PHδ1-GFP highlights PI(4,5)P2-rich patches that are not emphasized by the lipophilic dye DiD. (Bottom) Co-distribution of PI(4,5)P2-rich raft patches visualized with PHδ1-GFP and ppRFP. The images are z-stacks including all planes of these double-labeled living cells. (B) Comparable labeling patterns for PI(4,5)P2-rich raft complexes in living and fixed PC12 cells. The live-cell image (PH-GFP) was acquired 5′ after the addition of NGF. Fixative was added within 15–20 s after image acquisition, fixed cells were labeled for GAP43, and the PH-GFP-positive cell was retraced. (C) FRAP for ppGFP reveals specific immobilization of raft markers at PI(4,5)P2-rich raft patches. PC12 cells in the absence of NGF. Images are single confocal sections (patch, confocal plane slightly above substrate; nonpatch and podosome, bottom plane of cells). Arrows indicate bleached area at end of photobleaching time. Representative FRAP curves (individual experiments) and average FRAP half-lives (n = 15) are also shown in the figure. Bars, 3 μm.