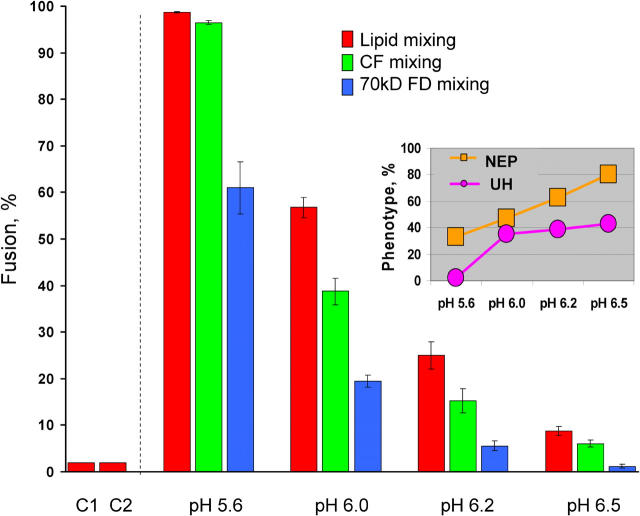
Figure 1.
Fusion phenotypes at different pH. Fusion of SIN E1-HAb2 cells with bound PKH26- and CF- or FD-labeled RBCs was triggered by a 5-min application of different pH: pH 5.6, 6.0, 6.2, and 6.5. Here and in other figures final extents of lipid mixing and CF and FD transfer assayed at neutral pH are shown by red, green, and blue bars, respectively. In the control experiments we either did not apply low pH (C1) or replaced SIN E1-HAb2 cells with uninfected HAb2 cells, pH 5.6 (C2). Here and in the subsequent figures bars are mean ± SD, n ≥ 3. The inset shows the relative frequency of UH phenotype among all lipid mixing events and NEP phenotype among all CF mixing events (see Materials and methods) for different pH.

