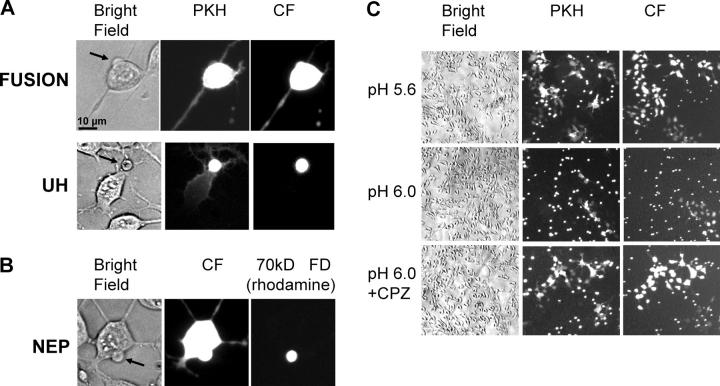
Figure 4.
RH and UH phenotypes and nonexpanding fusion pores in SFV E1 fusion. (A) Bright-field and fluorescent images for two SFV E1-HAb2 cell/RBC pairs after 5-min pulse of pH 6.0 represent the two phenotypes of lipid mixing: full lipid mixing correlated with content mixing (“fusion” in top panel) and partial lipid mixing correlated with UH (bottom panel). Spreading of the PKH26 and CF fluorescence from RBCs (marked by arrow in bright-field image) to the E1-HAb2 cell is shown upon completion of the lipid mixing event. (B) NEP phenotype observed in fusion between RBCs doubly labeled with CF and 70-kD RFD and bound SFV E1-HAb2 cell. Aqueous connection between the cells allows transfer of CF but not 70-kD RFD. (C) Low magnification images (bright field, PKH26- and CF-fluorescence) of SFV E1-HAb2 cells with bound RBCs treated with 5-min pulse of pH 5.6 or 6.0 (top and middle panels, respectively). Bottom panel shows the field of view for SFV E1-HAb2 cells with bound RBCs treated with 5-min pulse of pH 6.0 and then treated with a CPZ pulse to transform RH into complete fusion.

