
Figure 6.
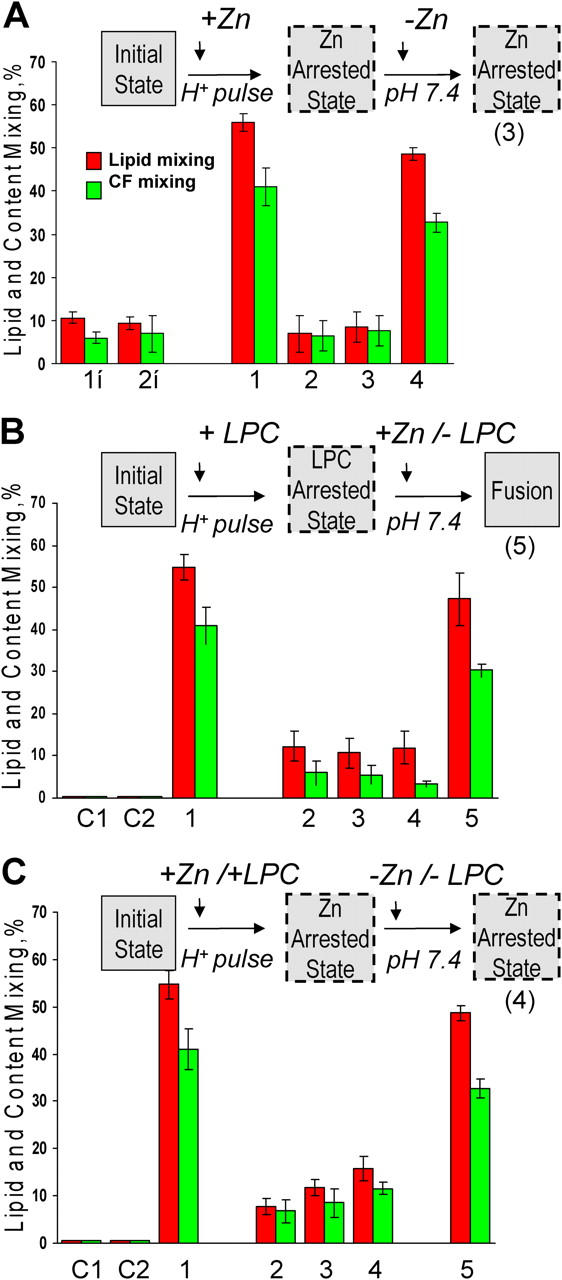
ZnAS precedes LAS. In these experiments we took advantage of the rapidness with which E1 fusion reaches its final extents under given conditions. Collecting video microscopy images for subsequent analysis and scoring fusion at several points in the experimental protocol (for instance, before and after removal of an inhibitor) allowed us to assay fusion extents for E1-HAb2 cells with bound RBCs under several conditions in the same dish rather than in independent experiments. Cartoons above A, B, and C illustrate the main finding of each figure. (A) Low pH application in the presence of Zn yields an arrested fusion stage, where E1 is neither irreversibly inactivated nor committed to fusion upon Zn removal. In the control experiment E1-HAb2 cells with bound RBCs were treated by a 5-min pH 6.0 pulse in the absence of Zn (bars 1). In the experiment on Zn inhibition (bars 2–4) fusion was first measured at the end of a 5-min pH 6.0 application in the presence of 5 mM Zn (bars 2). Fusion was next assayed after the cells were reneutralized and Zn removed (bars 3). The cells were treated by a second 5-min pH 6.0 pulse, and fusion was measured again (bars 4). The lack of E1 inactivation observed in this experiment is contrasted with the E1 inactivation observed when low pH was applied in the absence of the target membrane with or without Zn (bar 1i and 2i, respectively). SIN E1-HAb2 cells were treated with a 5-min pulse of pH 6.0, reneutralized, and incubated with RBCs for 15 min. Then, a second 5-min pulse of pH 6.0 was applied. Functional inactivation of E1 due to the first low pH pulse lowered fusion extents observed after the second pulse. (B) Fusion downstream of the LPC-arrested state is already insensitive to Zn. In the control experiment (bars 1) E1-HAb2 cells with bound RBCs were treated by a 10-min pH 6.0 pulse in the absence of fusion inhibitors. In the experiment shown in bars 2–5, E1-HAb2 cells with bound RBCs were incubated with lauroyl LPC for 5 min. Then, still in the presence of 70 μM lauroyl LPC, the cells were incubated for 5 min at pH 6.0. After taking video microscopy images for subsequent quantification (bars 2) the buffer was replaced by the pH 6.0 buffer supplemented with LPC and Zn. Thus the cells, while still kept at acidic pH and in the presence of LPC, were now exposed to Zn. After 5 min incubation we again measured fusion (bars 3). The cells were reneutralized still in the presence of LPC and Zn and fusion was measured again (bars 4). Finally, we removed LPC and assayed fusion at pH 7.4 still in the presence of Zn (bars 5). The control experiments shown in bars C1 and C2 were similar to that shown by bars 5, but we either omitted low pH application (C1) or replaced E1-HAb2 cells with noninfected HAb2 cells (C2). (C) SIN E1-HAb2 cells with bound RBCs acidified in the presence of both Zn and LPC do not reach LPC-arrested stage. In the control experiment E1-HAb2 cells with bound RBCs were treated by a 5-min pH 6.0 pulse in the absence of fusion inhibitors (bars 1). In the experiment shown in bars 2–5, E1-HAb2 cells with bound RBCs were incubated with both lauroyl LPC and Zn for 5 min at neutral pH. After taking video microscopy images for subsequent quantification, the cells were treated with a 5-min pulse of pH 6.0 still in the presence of both LPC and Zn. Fusion was quantified (bars 2) and then again assayed after reneutralization of the cells (bars 3) and removal of both LPC and Zn (bars 4). Bars 5: the cells were treated with a second 5-min pH 6.0 pulse, and fusion was measured again. The control experiments shown in bars C1 and C2 were similar to that shown by bars 4 but we either omitted low pH application (C1) or replaced E1-HAb2 cells with noninfected HAb2 cells (C2).