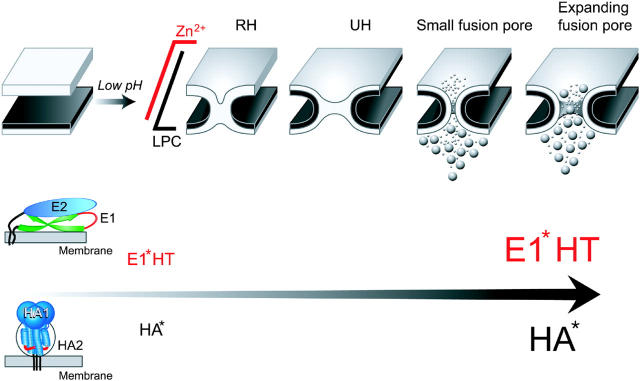
Figure 7.
The progression of fusion phenotypes upon an increase in the number of activated fusion proteins. In the schematic diagram of the fusion site, the top and bottom membranes represent a section of a fusion protein-expressing membrane and a section of a prelabeled target cell membrane, respectively. Acidification initiates restructuring of E1 and HA from very different initial conformations (see the text). Upon increase in the number of low pH–activated fusion proteins the observed fusion phenotype shifts from an initial state with two apposing membranes, to restricted hemifusion, RH, and then to unrestricted hemifusion, UH. The transfer of the lipid probe from the target cell membrane through the fusion site is first detected at UH. At still higher numbers of activated proteins E1* and HA* fusion phenotype advances beyond transient hemifusion phenotypes to an opening of a small fusion pore and, finally, to an irreversible expansion of the fusion pore. Transfer of small and large aqueous probes preloaded into target cell proceeds only upon formation of small and expanding fusion pores, respectively. LAS follows a trigger-dependent activation of fusion proteins and precedes the actual membrane merger. This sequence of fusion phenotypes is conserved between class I and class II fusion proteins. ZnAS, specific for E1-fusion, precedes formation of functional E1 homotrimers (E1* HT) and LPC-arrested stage.

