
Figure 3.
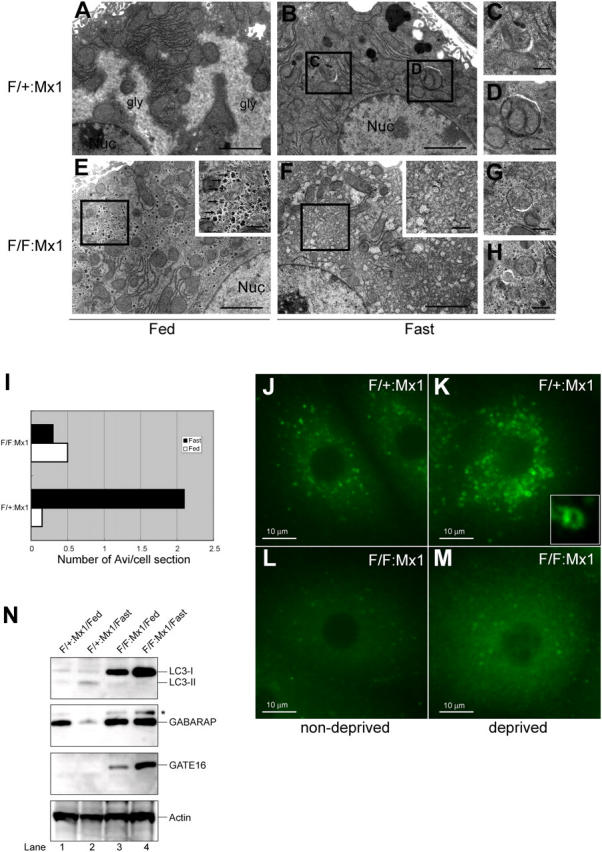
Impaired autophagosome formation in Atg7-deficient liver. (A–H) Electron micrographs of liver from Atg7 F/+:Mx1 (A–D) and Atg7 F/F:Mx1 (E–H) mice fed ad libitum (A and E) or fasted for 1 d (B and F). (C and D) Early stages of autophagic vacuoles observed in B are highlighted. (E and F) Autophagosome was not induced in mutant hepatocytes upon fasting. Insets show higher magnification views of glycogen granules. (G and H) Occasionally observed autophagosome-like structures in mutant hepatocytes. Bars: (A, B, E, and F) 5 μm; (C, D, G, and H) 0.5 μm. (I) Number of autophagosomes per hepatocyte (n = 20) in each genotype was counted and their averages are shown. (J–M) Immunofluorescent analysis of LC3 in primary cultured hepatocytes. Hepatocytes isolated from Atg7 F/+:Mx1 (J and K) and Atg7 F/F:Mx1 mice (L and M) were cultured in Williams' E (J and L) or Hanks' solution (K and M). Inset highlights the cup-like structure of LC3 observed in K. (N) Immunoblot analysis of Atg8 homologues in the liver. Atg7 F/+:Mx1 (lanes 1 and 2) and Atg7 F/F:Mx1 mice (lanes 3 and 4) were fed ad libitum (lanes 1 and 3) or fasted for 1 d (lanes 2 and 4), and then PNS fractions of liver were analyzed by immunoblotting with anti-LC3, GABARAP, GATE-16, and actin antibodies. Asterisk denotes a nonspecific band. Data shown are representative of three separate experiments.