
Figure 4.
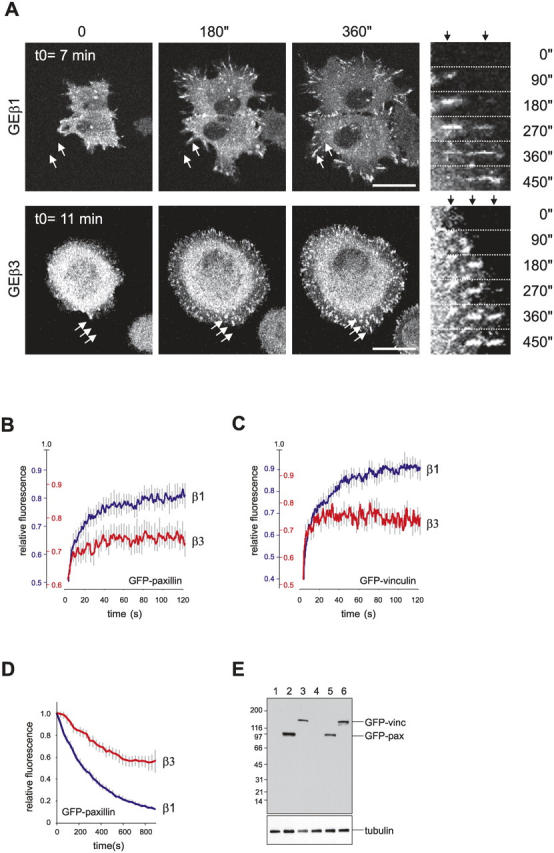
β1 and β3 integrins differentially regulate distribution and dynamics of cell–matrix adhesions. (A) Images of GEβ1 or GEβ3 cells stably expressing GFP-paxillin were taken at the cell–substrate contact area every 15 s after plating on FN-coated coverslips. The time after plating of the first image is indicated (t0). Bars, 10 μm. The right-most panel shows detailed images of the region indicated by arrows at the indicated time points. See supplemental data for the accompanying videos. (B and C) FRAP analysis of GFP-paxillin (B) and GFP-vinculin (C) in cell–matrix adhesions of GEβ1 or GEβ3 cells. Mean ± SEM of three independent experiments, in which at least six cells per experiment were analyzed, is shown. (D) FLIP analysis of GFP-paxillin in cell–matrix adhesions of GEβ1 or GEβ3 cells. Mean ± SEM of four independent experiments, in which 10 adhesions per cell in at least 3 cells per experiment were analyzed, is shown. (E) Western blot using GFP antibody and α-tubulin–loading control antibody on GEβ1 (lanes 1–3) and GEβ3 cells (lanes 4–6) stably expressing GFP-paxillin (lanes 2 and 5), GFP-vinculin (lanes 3 and 6), or controls (lanes 1 and 4). Molecular weights are indicated at the left. See supplemental data for example pictures of FLIP experiments (available at http://www.jcb.org/cgi/content/full/jcb.200412081/DC1).