
Figure 6.
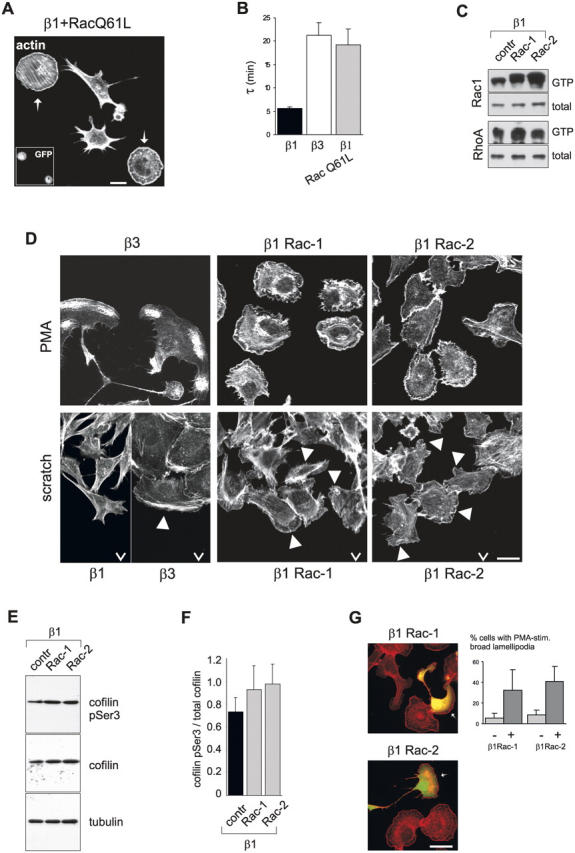
Expression of activated Rac in GEβ1 cells. (A) GEβ1 cells transiently transfected with RacQ61L in combination with GFP cDNA as a transfection marker (inset) were seeded on FN-coated coverslips 24 h after transfection for 12 h, and were fixed, permeabilized, and stained for F-actin. Arrows indicate transfected cells. Bar, 10 μm. (B) Analysis of GFP-paxillin dynamics in cell–matrix adhesions of GEβ1, GEβ3, and GEβ1 cells transiently transfected with RacQ61L in combination with dsRed cDNA as a transfection marker. Shown is the halftime of loss of fluorescence (τ) ± SEM calculated from FLIP experiments such as depicted in Fig. 4 D. (C) Rac1 and RhoA activity assay in control GEβ1 cells and two stable GEβ1RacQ61L clones. (D) GEβ1, GEβ3, and two GEβ1RacQ61L clones were plated on FN-coated coverslips either sparsely for 2 h followed by treatment with PMA for 1 h (top) or confluently overnight followed by wounding and incubation for an additional 5 h (bottom). Preparations were fixed, permeabilized, and stained for F-actin. Open arrowheads indicate the direction of the wound; filled arrowheads indicate lamellipodia. Bar, 10 μm. Note that GEβ1RacQ61L cells do not show extensive actin cytoskeletal remodeling such as seen in GEβ3 besides increased ruffling in response to PMA or wounding. (E) Control GEβ1 cells and two GEβ1RacQ61L clones were plated on FN-coated coverslips for 1 h. Western blot analysis of total lysates with the indicated antibodies is shown. (F) Mean ± SD of relative cofilin Ser3 phosphorylation determined from two individual experiments such as depicted in E. (G) GEβ1RacQ61L clones were transiently transfected with a plasmid encoding GFP-tagged dominant-active cofilinS3A 24 h before plating on FN-coated dishes. After 2 h of adhesion, cells were stimulated with PMA for 1 h, fixed, permeabilized, and stained for F-actin. Arrows indicate transfected cells. Note ruffling in nontransfected cells versus extensive cytoskeletal reorganization in transfected cells. Bar, 10 μm. Quantification of the percentage of cells responding to PMA treatment by formation of broad lamellipodia is depicted in the graph. Mean ± SD of ∼100 cells analyzed in two independent assays is shown.