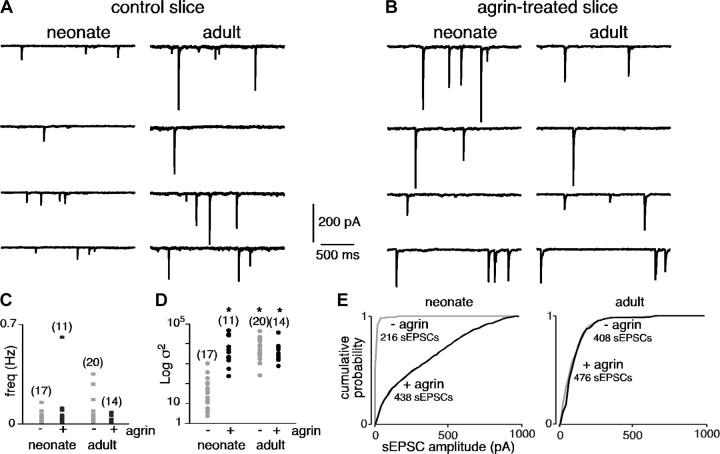
Figure 2.
Effect of prolonged agrin treatment on spontaneous excitatory synaptic activity recorded in adult and neonate chromaffin cells (holding potential −80 mV). (A and B) Chart recordings illustrating sEPSCs in control and agrin-treated slices (4–5 h before recordings). (C and D) Summarized effects of agrin on sEPSC frequency and amplitude variance. *, P < 0.01 compared with untreated slices. (E) Plots showing the cumulative probability of sEPSC amplitude.

