Figure 2.
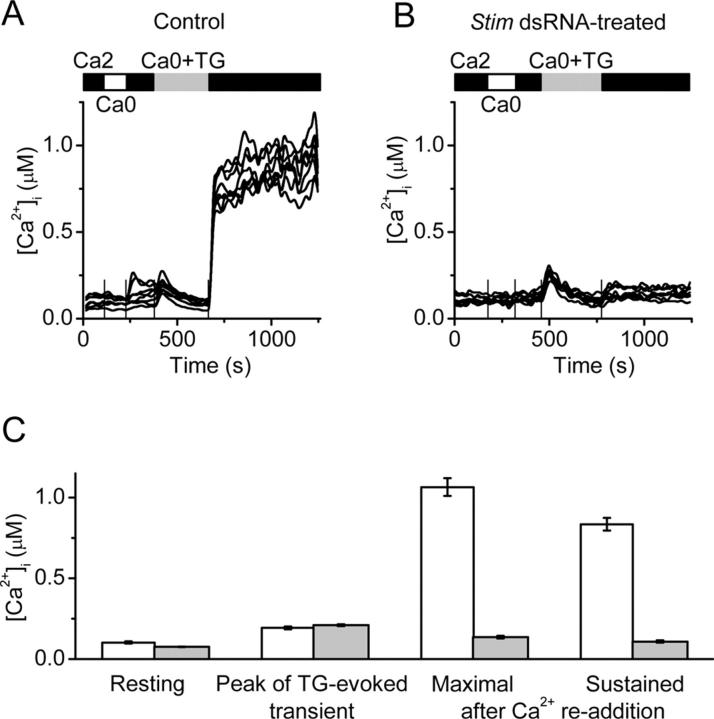
Suppression of Ca 2+ signal by Sti m dsRNA treatment. (A) [Ca2+]i in single cells treated with CG1560 dsRNA (control). Solution exchanges are indicated by solid (S2 Ringer with 2 mM Ca2+), open (Ca2+ free), and gray (Ca2+-free containing 1 μM TG) bars, respectively. Vertical lines indicate the time of solution exchange. (B) Intracellular Ca2+ responses in S2 cells treated with Stim dsRNA. (C) Averaged values ± SEM for control cells (n = 46 cells in two representative experiments, white bars) and Stim dsRNA-treated (n = 197 cells in three representative experiments, gray bars): resting [Ca2+]i; peak [Ca2+]i during the TG-evoked release transient; maximal and sustained (5 min) [Ca2+]i after readdition of 2 mM external Ca2+. The values of maximal [Ca2+]i and sustained [Ca2+]i in control and Stim suppressed cells are significantly different (P < 5 × 10⁻⁶).

