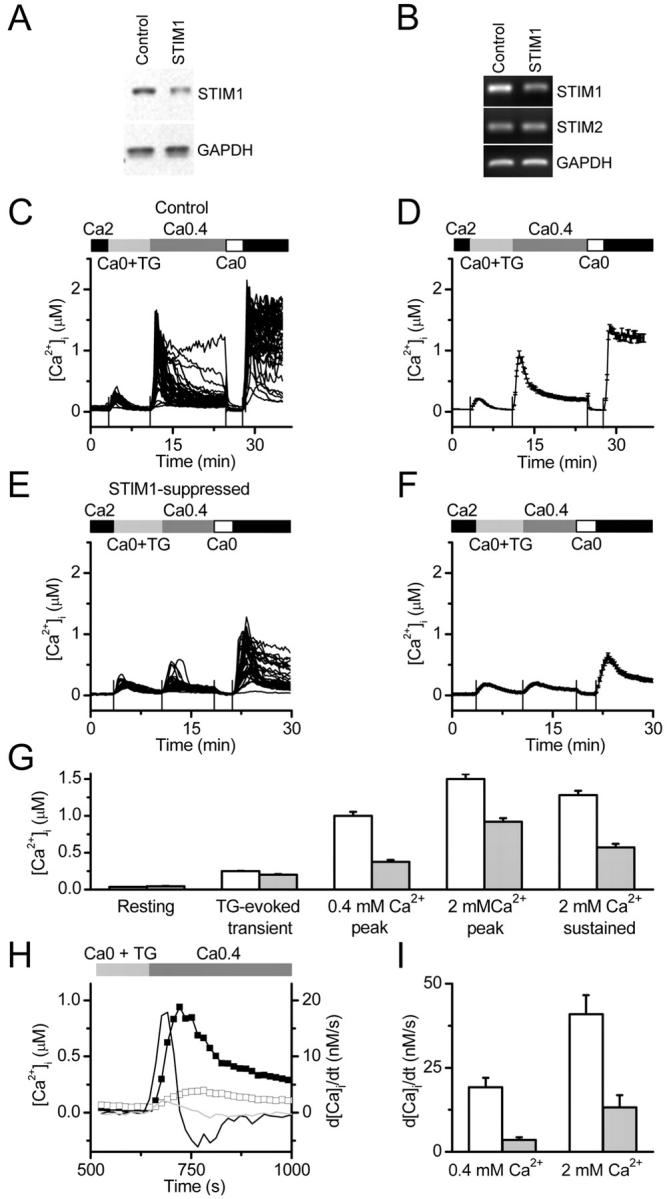
Figure 4.

The effect of STIM1 suppression on Ca 2+ signaling in individual Jurkat T cells. (A) Western blot of 4A5 cell lysates (lane 2), compared with control 2A4 cells (lane 1) showing >50% reduction in STIM1 protein, with no change in the protein levels of GAPDH. (B) The specificity of STIM1 suppression was confirmed by RT-PCR analysis showing a reduction in STIM1, but not STIM2 or GAPDH, mRNA levels in 4A5 cells (lane 2) compared with control 2A4 cells (lane 1). (C) Intracellular Ca2+ responses in 51 Jurkat 2A4 control cells. Cells were bathed in Jurkat Ringer (2 mM Ca2+), low-Ca2+ (0.4 mM) Jurkat Ringer, and Ca2+-free Jurkat Ringer with 1 μM TG, as indicated. The first peak is due to Ca2+ release from internal stores in the presence of TG. The second and third peaks result from Ca2+ entry through CRAC channels upon addition of 0.4 and 2 mM external Ca2+, respectively. Sustained [Ca2+]i was measured 5 min after readdition of 2 mM external Ca2+. (D) Averaged [Ca2+]i in control 2A4 cells from the same experiment. (E) Intracellular Ca2+ responses in 40 STIM1-suppressed 4A5 Jurkat cells. (F) Averaged [Ca2+]i in STIM1-suppressed 4A5 cells from the same experiment as in D. (G) Combined data from three control experiments (164 cells, white bars) and three experiments with STIM1-suppressed cells (141 cells, gray bars). Averaged values of peak and sustained [Ca2+]i are significantly different in STIM1-suppressed cells (P < 8 × 10⁻⁶, < 8 × 10⁻⁶, and < 2 × 10⁻⁵, respectively, by independent two populations t test). (H) Maximal rate of Ca2+ rise upon Ca2+ readdition as an estimate of Ca2+ influx. Representative averaged traces obtained in the same experiments as in A–D are shown (control 2A4 cells, closed squares; STIM1-suppressed 4A5 cells, open squares), along with corresponding differentiated [Ca2+]i traces, d[Ca2+]i/dt (right axis), for control 2A4 cells (black line without symbols) and STIM1-suppressed 4A5 cells (gray line). The peak derivatives correspond to the maximal rate of Ca2+ rise in nM. (I) STIM1 expression and d[Ca2+]i/dt. The maximal rate of [Ca2+]i rise after 0.4 mM or 2 mM Ca2+ readdition in control 2A4 cells (white bars: 164 cells in three experiments); and STIM1-suppressed 4A5 cells (gray bars: 141 cells in three experiments; P < 3 × 10⁻⁷ or < 2 × 10⁻⁷ for 0.4 and 2 mM Ca2+, respectively).
